
Bounce off the average, the buy signal holds
Occidental Petroleum stock dips 0.4%, bounces off its 20-day average
Bounce off the average, the buy signal holds
Our view last week
Occidental Petroleum shares add 4.4% this week, the fourth straight session of higher lows running from the 48 area toward 54. In this weekly technical analysis the buy signal that fired seven days ago holds: the first week closes higher and confirms the entry. Underneath, though, three technical warnings are piling up - contracting volumes, fading candle conviction, a deepening distribution phase - while the stock stays boxed between a resistance and a support sitting close together.
This week's summary
Occidental Petroleum stock bounces off its 20-day moving average: a clean touch in the 55 area followed by a same-day rebound of 4%, while the weekly close stays essentially flat (-0.4%). In this technical analysis the buy signal that fired two weeks ago holds: the confirmation week closes higher and signal strength stays high. The trade is already up 4% since entry, with earnings landing this very week.
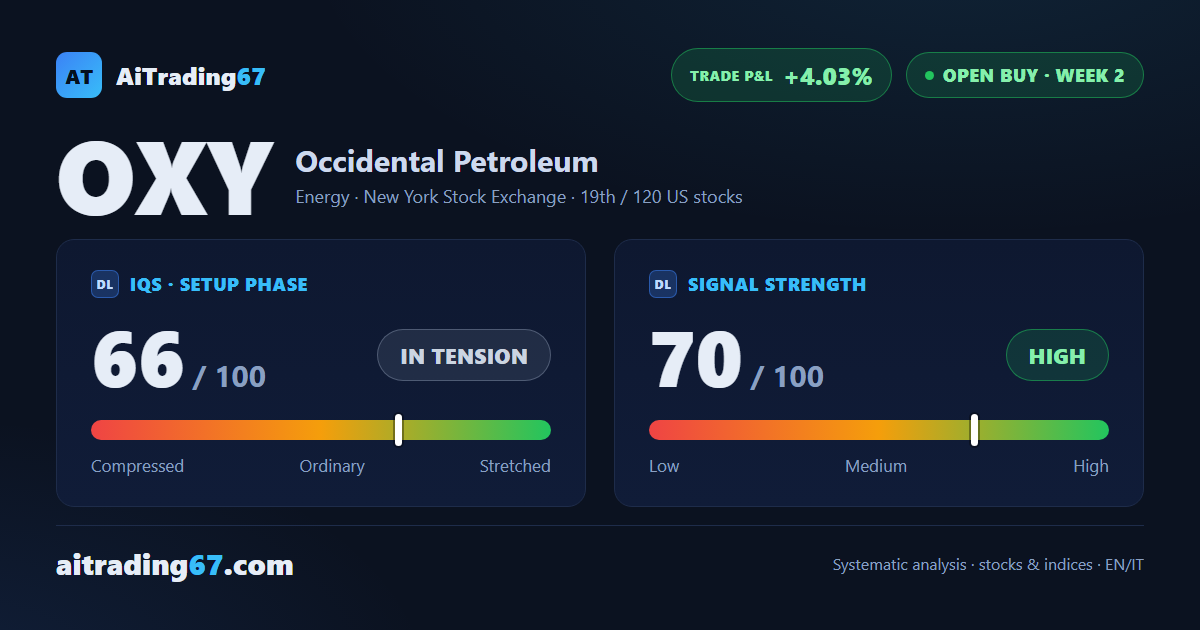
IQS Phase
66
in tension
Signal Strength
70
high · wide move
Sizing
FULL
Ranking
#19 / 120
US stocks in progress
Trade P&L %
+4.03%
from signal to date, no stop loss
Rank position
ranks 19th among the 120 Longs already running for US stocks in our ranking, with a signal strength of 70 out of 100.
Sector context
SectorEnergy
Benchmark ETFXLE
Sector regimein positive regime
Performanceweekly -0.12% · monthly +12.76%
OXY belongs to the energy sector (reference ETF XLE). The sector is classified in positive regime according to our weekly reading.
restricted Platinum content