EN IT

PG&E: week 11 of decline, double bottom forming

PG&E is in week 11 of a sell signal. The AT picture shows mixed signals: buy volumes recovering and a daily double bottom in the 16 area, while CMF remains negative and the decline holds on a directional basis.

PG&E: week 11 of decline, double bottom forming
Sell signal · Week 11
PG&E: week 11 of decline, double bottom forming
June 12, 2026
Sell signal · Week 11
In Summary
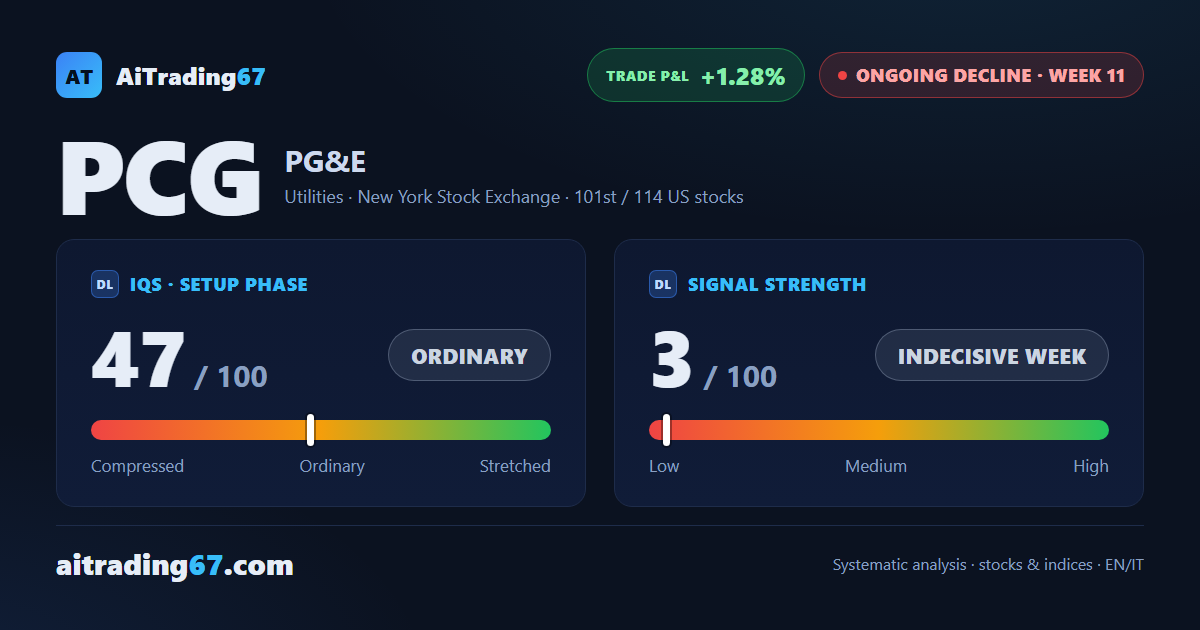
PG&E is in week 11 of a sell signal, with a +1.28% gain from the open. The technical picture has turned mixed: the week closed with a modest decline, but the daily double bottom in the 16 area with an 11% intermediate rebound is the pattern to watch most closely. The quality band signals trading not recommended: investors not already positioned do not find a favorable entry point here.
Ongoing decline ·11th week from start ·US stocks ·T2 ★ See Gold version →
IQS Phase
47
ordinary
Signal Strength
3
indecisive week
Sizing
MINIMUM
Ranking
#101 / 114
US stocks
Trade P&L %
+1.28%
from signal to today
Chart · Weekly — EMA50 · MACD · VWAP
Weekly chart · EMA50 · MACD · VWAP · Source: TradingView
How to read this pageA visual guide to the post, card by card
The full analysis, operating plan and detailed levels on this asset are reserved for clients ★ PLATINUM
restricted Platinum content
Share WhatsApp Telegram Gmail LinkedIn