
Sell in management, support holds
PepsiCo drops 4.7% this week, but the double bottom in the 135 area holds
Sell in management, support holds
Our view last week
Week 16 of the sell signal on PepsiCo: the week closed up 2%, with buy volume at 95%, but the recent picture stays mixed rather than directional. Quarterly earnings land this week, on July 9 — extra event risk on a stock currently tracing a double bottom with an intermediate rebound on the daily chart.
This week's summary
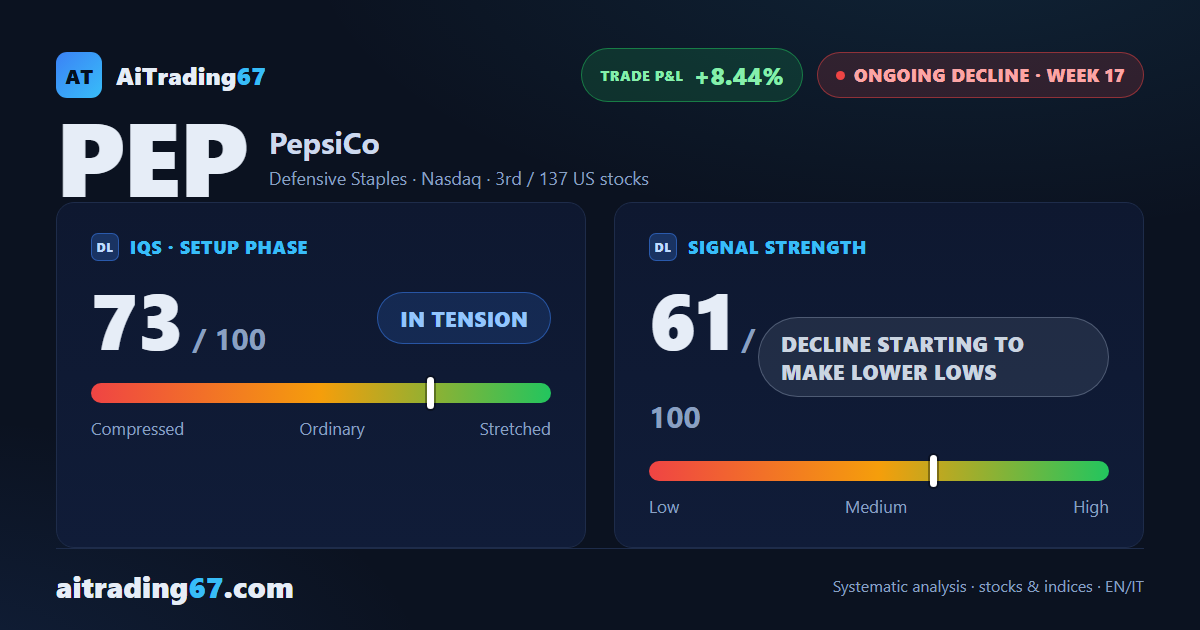
After last week's 2% bounce, PepsiCo shares gave back 4.7% this week: a sharp reversal, with sellers making up 81% of volume and the RSI down to 37.8. On the daily chart, though, a double bottom in the 135 area is holding, with an 11% rebound. The Sell signal has been under management for 17 weeks, the short up 8.4%; the July 9 earnings report is now behind it.
IQS Phase
73
in tension
Signal Strength
61
decline starting to make lower lows
Sizing
STANDARD
Ranking
#3 / 137
US stocks
Trade P&L %
+8.44%
from signal to today
restricted Platinum content