
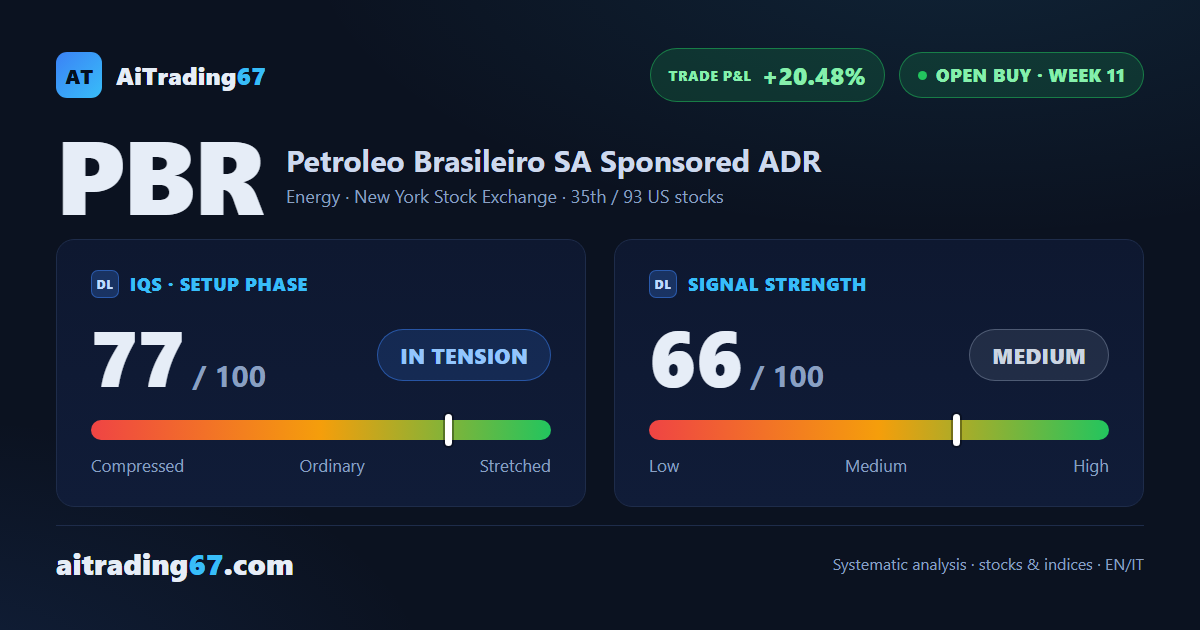
Buy signal in week 11, trade up 20.5%
Petrobras gains 6.3% and reclaims its 20-day average, with the highs within reach
Our view last week
A second losing week for Petrobras stock: down 2.1% after last week's 1.9% dip, and in the weekly bar sellers stayed extremely dominant, with buying below 25% of volume. The underlying trend still holds: ADX has been rising for 4 weeks and price stays above its 50-week average. This technical analysis follows one of the energy stocks with an open buy signal, 13.4% in profit since entry, where price action now calls for care.
This week's summary
After 2 losing weeks Petrobras changes pace: up 6.3%, with a bounce off the 20-day moving average that carries price back to the edge of its 90-day high, in the 22 area. Petrobras stock holds well above its 50-week average, ADX has been rising for 5 weeks and the weekly MACD is improving again. Among US stocks with weekly buy signals this one is up 20.5% since entry: price action is clean again, but there is little room left before resistance.
IQS Phase
77
in tension
Signal Strength
66
medium
Sizing
STANDARD
Ranking
#35 / 93
US stocks in progress
Trade P&L %
+20.48%
from signal to date, no stop loss
Petroleo Brasileiro (PBR) weekly chart — EMA50 · MACD · VWAP
Weekly chart · EMA50 · MACD · VWAP · Source: TradingView
Rank position
ranks 35th among the 93 Longs already running for US stocks in our ranking, with a signal strength of 66 out of 100.
Sector context
SectorEnergy
Benchmark ETFXLE
Sector regimein positive regime
Performanceweekly +1.26% · monthly -3.50%
PBR belongs to the energy sector (reference ETF XLE). The sector is classified in positive regime according to our weekly reading.
restricted Platinum content