Sell signal at week 13 — the decline is losing momentum
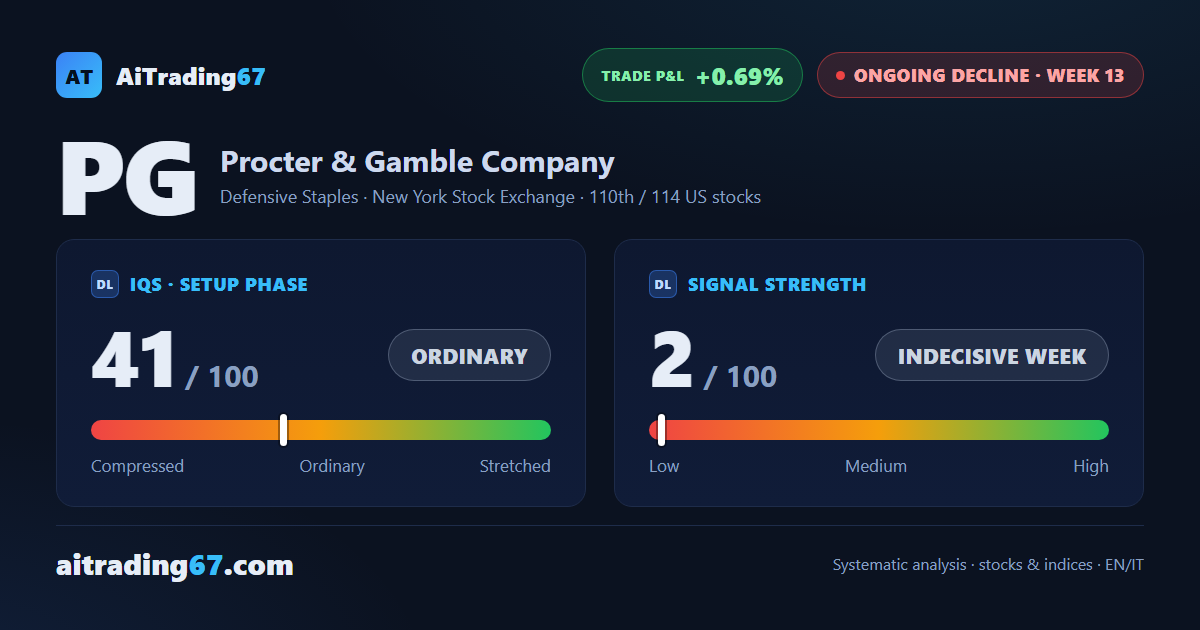
Procter & Gamble: 13 weeks into a sell signal, but the technical picture is turning
Sell signal at week 13 — the decline is losing momentum
In Summary
At week 13 of the sell signal, Procter & Gamble is in increasingly contested technical territory. The decline has lost momentum: CMF back in positive territory, MACD recovering, and a double bottom in the 139 area that has halted the move lower. The week closed up 2.1% with buyers at 86%. An evolution worth watching closely.
IQS Phase
41
ordinary
Signal Strength
2
indecisive week
Sizing
MINIMUM
Ranking
#110 / 114
US stocks
Trade P&L %
+0.69%
from signal to today
restricted Platinum content