
Prysmian's decline shows no signs of slowing
Prysmian slides 7.2% as the decline keeps making lower lows
Prysmian's decline shows no signs of slowing
Our view last week
Prysmian closed the week down 7.7%, and the picture has flipped: after 26 weeks in a buy trade running at +62.77%, a fresh Sell signal has just opened, third-strongest among the 54 European sell signals. The stock is still 94% above its 200-week average: there is still room to fall. Our model flags high-risk conditions for anyone looking to open a new short here.
This week's summary
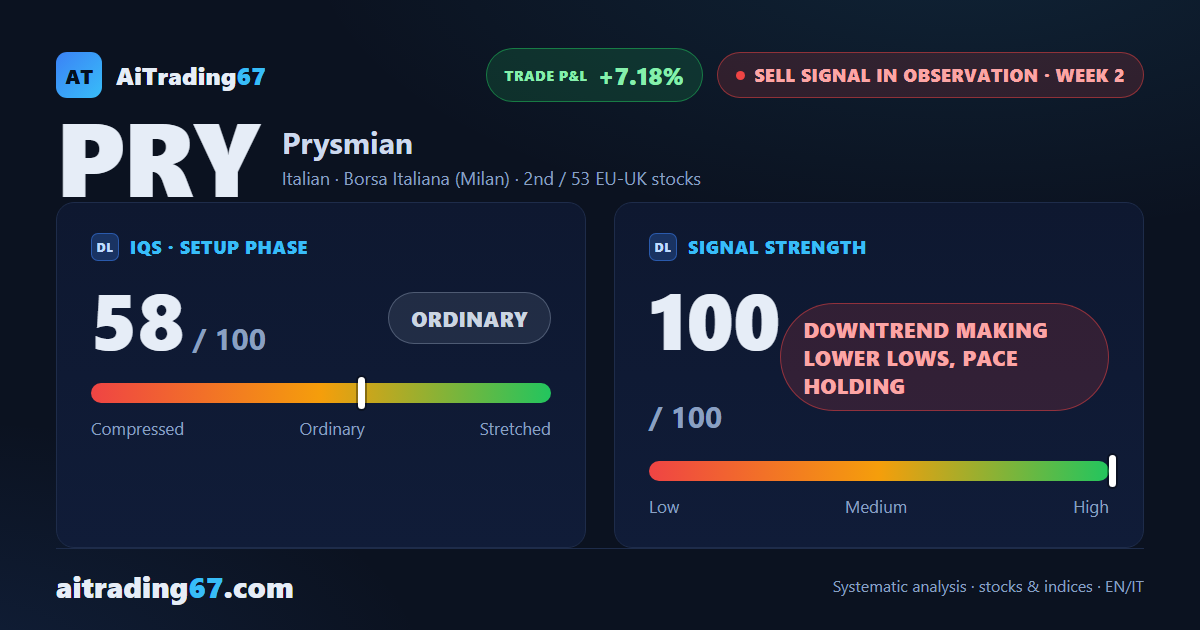
Prysmian's Sell signal enters its second week and confirms the move with a 7.2% drop, second-strongest among the 53 European sell signals. Signal strength at its ceiling, 100 out of 100, reads a downtrend making lower lows with pace holding, while on the daily chart a double bottom in the 130 area produced only a 9% intraday rebound. The stock is still nearly 80% above its 200-week average, and the quality band flags trading as not recommended for a fresh short here.
Sell signal in observation
·2nd week from start
·EU-UK stocks
·T2
·📅 Earnings · Jul 30
★ See Gold version →
IQS Phase
58
ordinary
Signal Strength
100
downtrend making lower lows, pace holding
Sizing
STANDARD
Ranking
#2 / 53
EU-UK stocks sell signals
Trade P&L %
+7.18%
from signal to today
restricted Platinum content