
Prysmian's bounce stalls right under resistance
Prysmian gains 1.2% but the bounce stalls right at key resistance
Prysmian's bounce stalls right under resistance
Our view last week
Prysmian's Sell signal enters its second week and confirms the move with a 7.2% drop, second-strongest among the 53 European sell signals. Signal strength at its ceiling, 100 out of 100, reads a downtrend making lower lows with pace holding, while on the daily chart a double bottom in the 130 area produced only a 9% intraday rebound. The stock is still nearly 80% above its 200-week average, and the quality band flags trading as not recommended for a fresh short here.
This week's summary
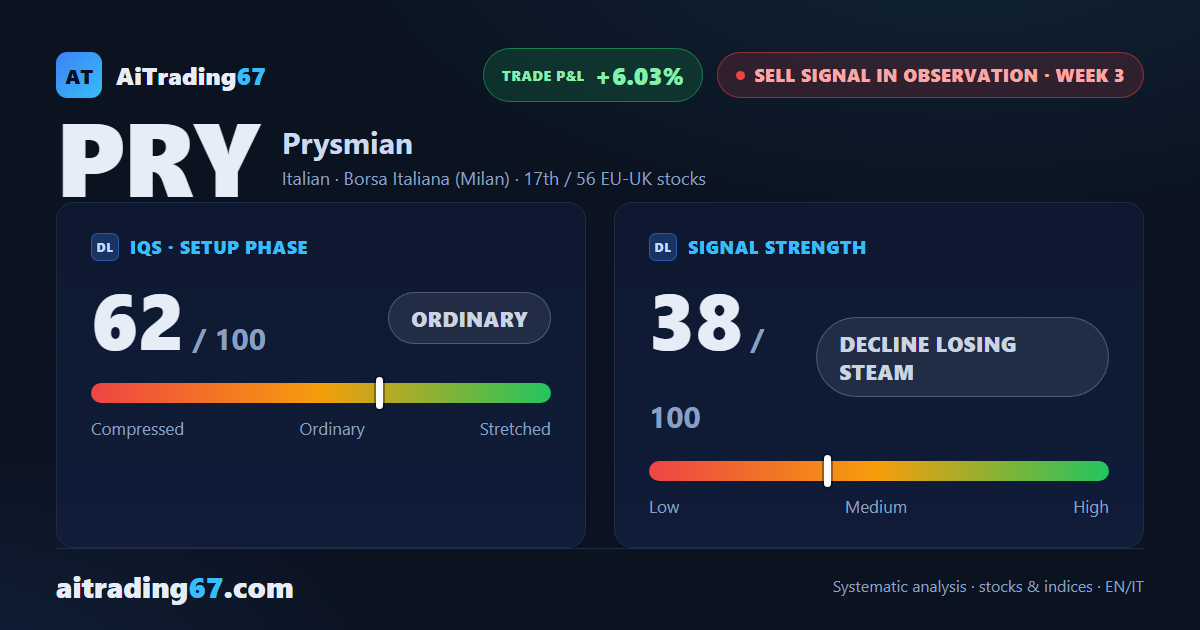
Prysmian's bounce stalled right where our model expected it to: the stock tested its 100-day moving average in the 129 area and was firmly rejected, closing the week up 1.2%. The Sell signal enters its third week and strength drops to 38 out of 100: the decline is losing pace without truly reversing course. The stock is still nearly 80% above its 200-week average, and earnings on July 30 land this very week.
Sell signal in observation
·3rd week from start
·EU-UK stocks
·T2
·📅 Earnings · Jul 30
★ See Gold version →
IQS Phase
62
ordinary
Signal Strength
38
decline losing steam
Sizing
REDUCED
Ranking
#17 / 56
EU-UK stocks sell signals
Trade P&L %
+6.03%
from signal to today
Rank position
ranks 17th among the 56 sell signals for European-UK stocks in our ranking, with a signal strength of 38 out of 100.
Sector context
SectorItalian
Benchmark ETFEXH4
Sector regimein positive regime
Performanceweekly +1.57% · monthly +0.29%
PRY belongs to the italian sector (reference ETF EXH4). The sector is classified in positive regime according to our weekly reading.
restricted Platinum content