
Sell signal · week 13 · Borsa Italiana (Milan)
Prysmian rebounds 6% off its 20-day average and climbs back above the 20-week line
Our view last week
Prysmian ends the week flat, but volume flips: 87% of the week's trade went to sellers, after 4 weeks with buyers in the majority. Money flow stays positive and the MACD histogram has improved for 4 weeks, while the ADX has been falling for 16: a decline losing conviction. For swing trading on Prysmian stock, price is pinned between the daily VWMA, in the 122.7 area, and the 7-day low, in the 121.3 area. The short stands 9.4% in profit.
This week's summary
Prysmian gains 6% on the week, bouncing off its 20-day moving average in the 124 area and climbing back above the 20-week average. A week ago the decline was losing conviction, and now the price action points the same way: money flow and the MACD histogram have improved for 5 weeks, the ADX has fallen for 17. In this technical analysis of Prysmian stock the Sell signal is still live, with price right under the Inversion Point, in the 132 area, and earnings on October 29 drawing closer.
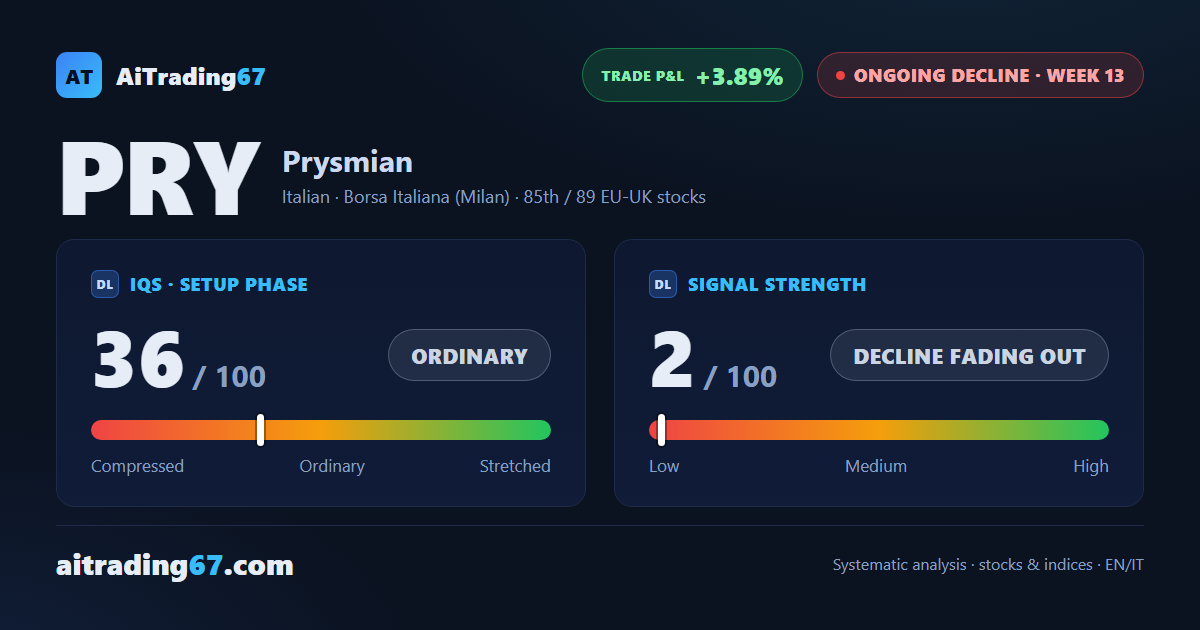
IQS Phase
36
ordinary
Signal Strength
2
decline fading out
Sizing
MINIMUM
Ranking
#85 / 89
EU-UK stocks
Trade P&L %
+3.89%
from signal to date, no stop loss
Prysmian (PRY) weekly chart — EMA50 · MACD · VWAP
Weekly chart · EMA50 · MACD · VWAP · Source: TradingView
Rank position
ranks 85th among the 89 sell signals for European-UK stocks in our ranking, with a signal strength of 2 out of 100.
Sector context
SectorItalian
Benchmark ETFEXH4
Sector regimeweak phase
Performanceweekly -0.03% · monthly +0.15%
PRY belongs to the italian sector (reference ETF EXH4). The sector is classified weak phase according to our weekly reading.
restricted Platinum content