
Sell signal in week 4 · US stocks
Pulmonx slips 4.2% and leans on its 20-week average as volume contracts
Our view last week
After last week's 11.9% rebound, the stock gave back 7.7%: sellers were extremely dominant again in the weekly bar, with buying below 25% of volume, and money keeps leaving on the daily chart. Pulmonx stock stays below its 50-week moving average, squeezed between the 200-day moving average, in the 1.92 area, and the 7-day low, in the 1.88 area. Our technical analysis reads a sell signal in week 3 on one of the US stocks we track, a price action trading case to follow with caution.
This week's summary
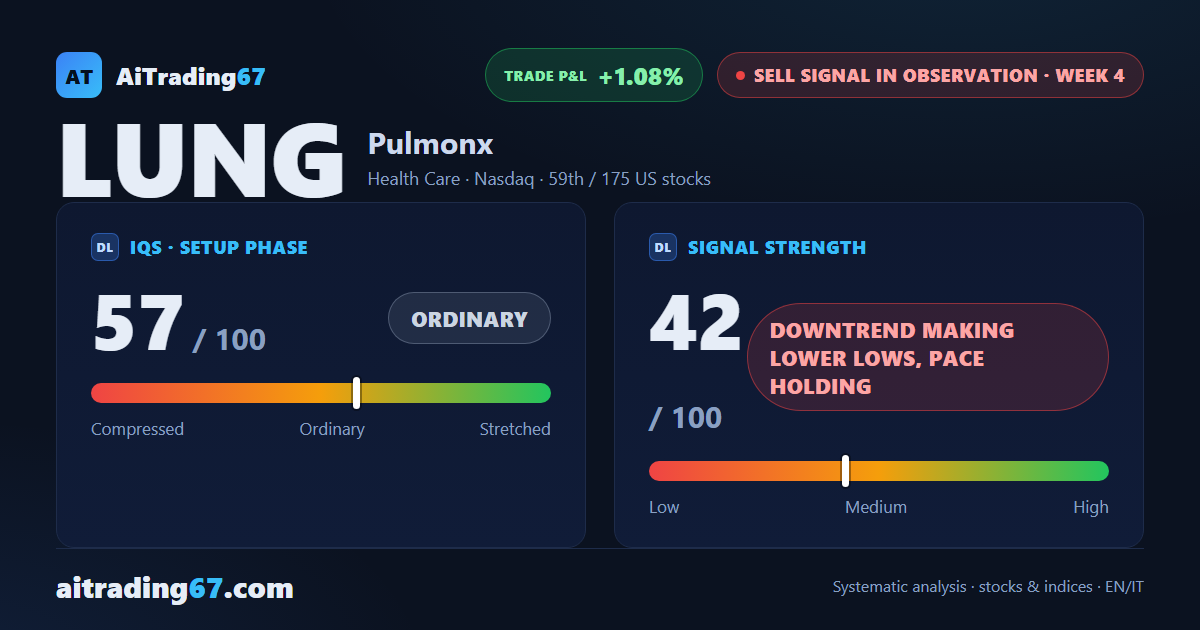
After last week's 7.7% loss, Pulmonx stock gave up another 4.2% on contracting volume and stopped just above its 20-week moving average, in the 1.82 area. On the daily chart the price action shows a bearish engulfing and money flow stays negative. Our technical analysis reads a sell signal that is finding its stride again, a downtrend making lower lows, on a highly volatile name among the US stocks we track: opening here remains not recommended.
IQS Phase
57
ordinary
Signal Strength
42
downtrend making lower lows, pace holding
Sizing
REDUCED
Ranking
#59 / 175
US stocks sell signals
Trade P&L %
+1.08%
from signal to date, no stop loss
Pulmonx (LUNG) weekly chart — EMA50 · MACD · VWAP
Weekly chart · EMA50 · MACD · VWAP · Source: TradingView
Rank position
ranks 59th among the 175 sell signals for US stocks in our ranking, with a signal strength of 42 out of 100.
Sector context
SectorHealth Care
Benchmark ETFXLV
Sector regimein positive regime
Performanceweekly -2.65% · monthly -3.91%
LUNG belongs to the health care sector (reference ETF XLV). The sector is classified in positive regime according to our weekly reading.
restricted Platinum content