
Sell signal, second week
D-Wave Quantum sinks 16.7% as the decline holds its lower lows
Sell signal, second week
Our view last week
D-Wave Quantum stock changes script: the buy signal that ran for 11 weeks, with all 3 targets of our most advanced model already hit, gives way to a fresh Sell signal. The week just closed shed 10.8%, with buyers collapsing and the stock already sliding into a distribution phase. Price still sits 59.6% above its 200-week average - plenty of room to keep falling, but our model flags trading as not recommended.
This week's summary
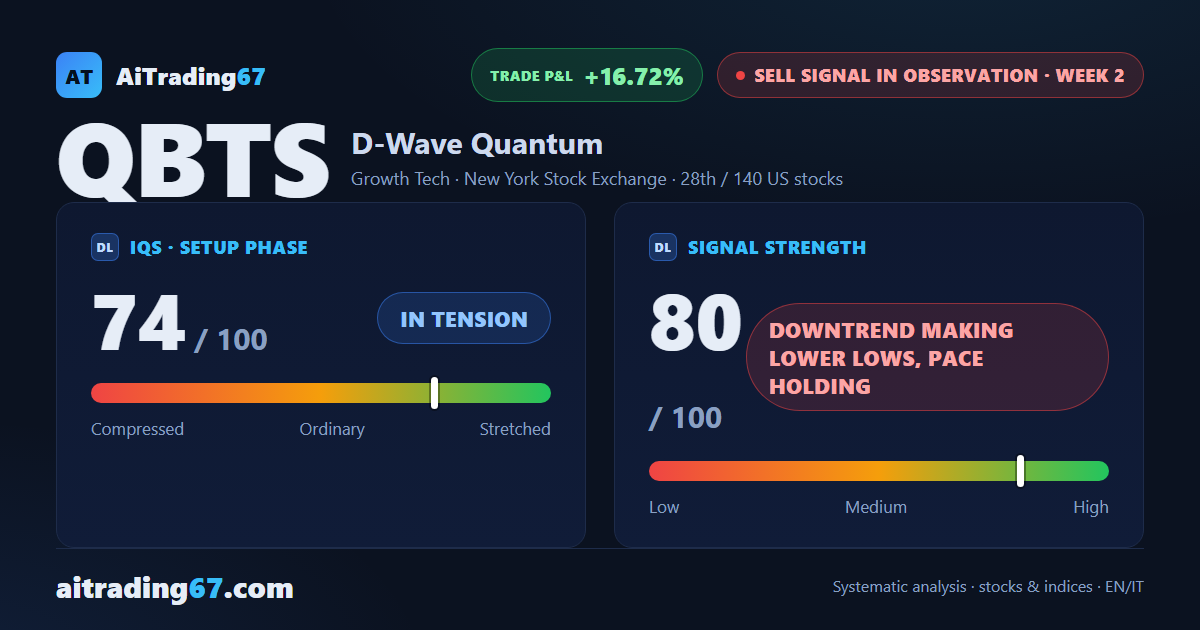
D-Wave Quantum stays bearish: after last week's -10.8%, the stock sheds another 16.7% this week. The daily chart tells a clear story - 5 lower highs, sliding from the 27 area to 19 - with buyer dominance collapsing and distribution underway. Signal strength climbs to 80 out of 100 and reads "downtrend making lower lows, pace holding": no sign of exhaustion. The stock ranks 28th among 140 US sell signals, with the short already more than 16% in profit.
Sell signal in observation
·2nd week from start
·US stocks
·T2
·📅 Earnings · Aug 6
★ See Gold version →
IQS Phase
74
in tension
Signal Strength
80
downtrend making lower lows, pace holding
Sizing
STANDARD
Ranking
#28 / 140
US stocks sell signals
Trade P&L %
+16.72%
from signal to today
restricted Platinum content