
Decline stalls between support and resistance
Qualcomm slips 2.8% as the decline stalls and the ADX fades
Decline stalls between support and resistance
Our view last week
Qualcomm sheds 9.2% this week, wiping out most of the bounce from seven days ago, and breaks down through the levels that had held it in check: the daily Kumo floor and the pivot-point average. On the daily chart, though, a clean double bottom forms in the 168 area, with an intermediate 19% rebound and sellers losing ground on the last bar. Signal strength climbs to 52 out of 100 — "lower lows, pace holding" — but volatility stays elevated and trading is still not recommended.
This week's summary
Qualcomm stock closes the week down 2.8%, with 91% of daily volume on the sell side. Price, though, stays boxed between the first support, in the 165 area, and the first resistance, in the 168 area — a tight corridor the double bottom from two weeks ago hasn't broken to the downside yet. The ADX has now declined for a fourth straight week: the decline is losing conviction even as its direction stays negative.
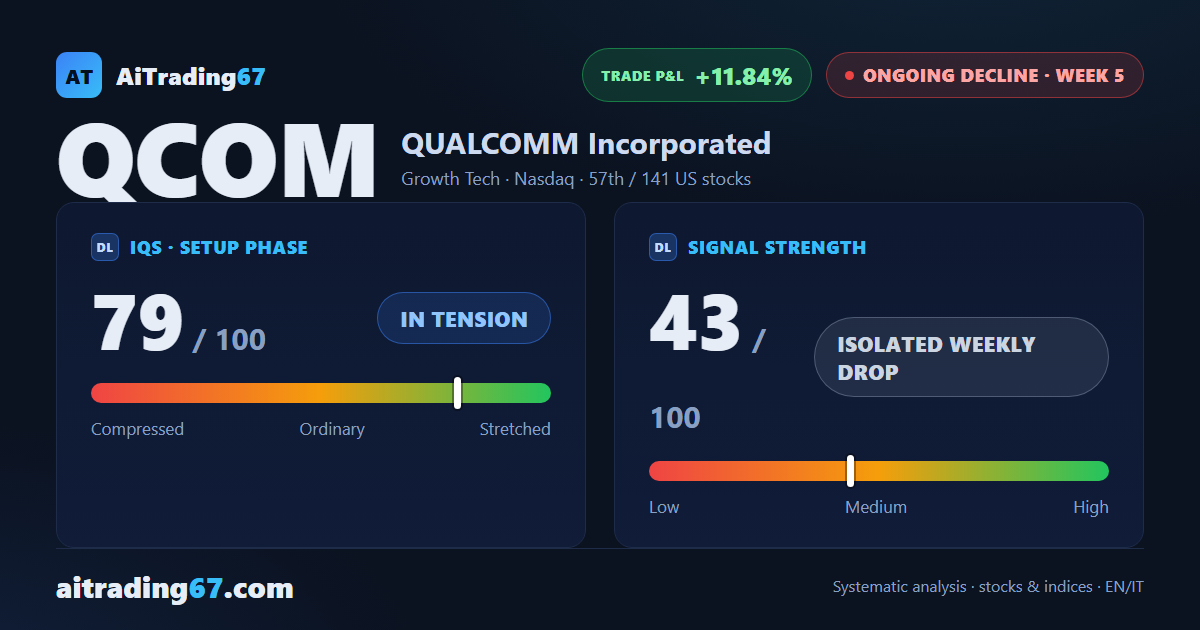
IQS Phase
79
in tension
Signal Strength
43
isolated weekly drop
Sizing
REDUCED
Ranking
#57 / 141
US stocks
Trade P&L %
+11.84%
from signal to today
Rank position
ranks 57th among the 141 sell signals for US stocks in our ranking, with a signal strength of 43 out of 100.
Sector context
SectorGrowth Tech
Benchmark ETFXLK
Sector regimeweak phase
Performanceweekly +0.17% · monthly -3.92%
QCOM belongs to the growth tech sector (reference ETF XLK). The sector is classified weak phase according to our weekly reading.
restricted Platinum content