
Tech ETF: sellers cool the bounce, buy signal holds
QDVE slips 3.5% as the 41-area double bottom holds up the buy signal
Tech ETF: sellers cool the bounce, buy signal holds
Our view last week
This week the iShares S&P 500 Information Technology Sector ETF rose 1.8%, with buyers firmly back in control: 95% of the week's volume was on the buy side, after a choppier stretch. The weekly RSI climbs to 66, still short of extremes, but short-term momentum keeps cooling and price is boxed in near recent highs. The trade is now in week 12, up 17% since entry.
This week's summary
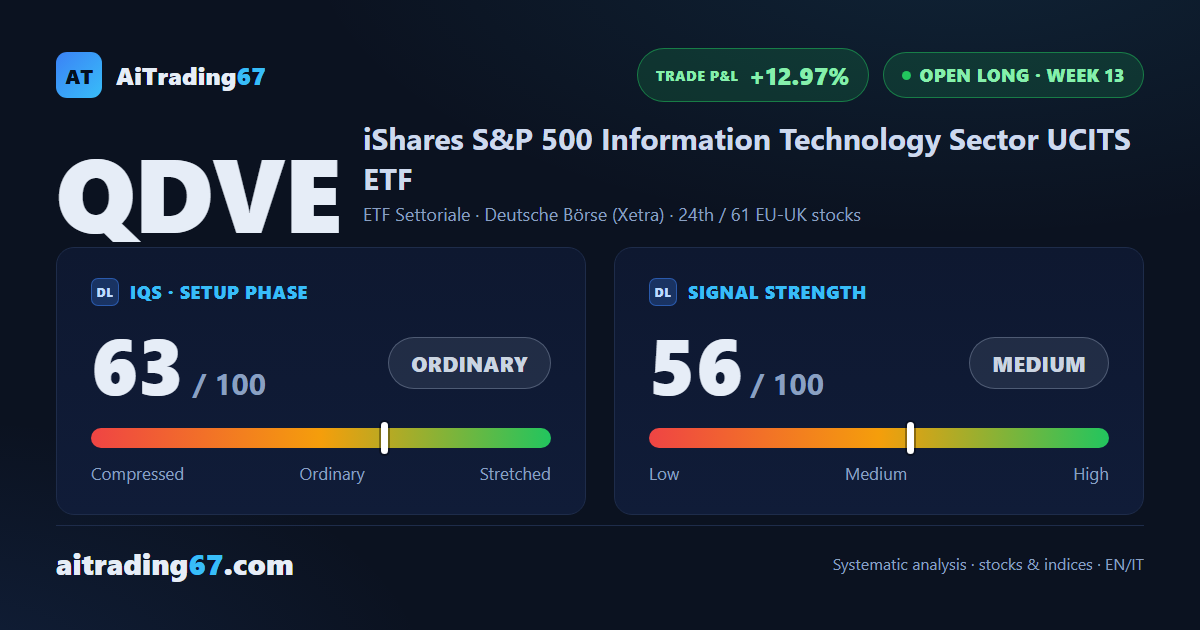
In this week's QDVE technical analysis, the iShares US technology sector ETF gave back 3.5%, with sellers back in control (71% of the week's volume) after a buyer-led close to June. Momentum has cooled for a third straight week, yet the daily chart holds a clean double bottom in the 41 area, with a 9% intermediate rebound. The buy signal, now in week 13, is still up almost 13%.
IQS Phase
63
ordinary
Signal Strength
56
medium
Sizing
STANDARD
Ranking
#24 / 61
EU-UK stocks in progress
Trade P&L %
+12.97%
from signal to today
restricted Platinum content