
EN IT

Nasdaq 100, the rally holds but the engine slows: week 10 at +8.9%

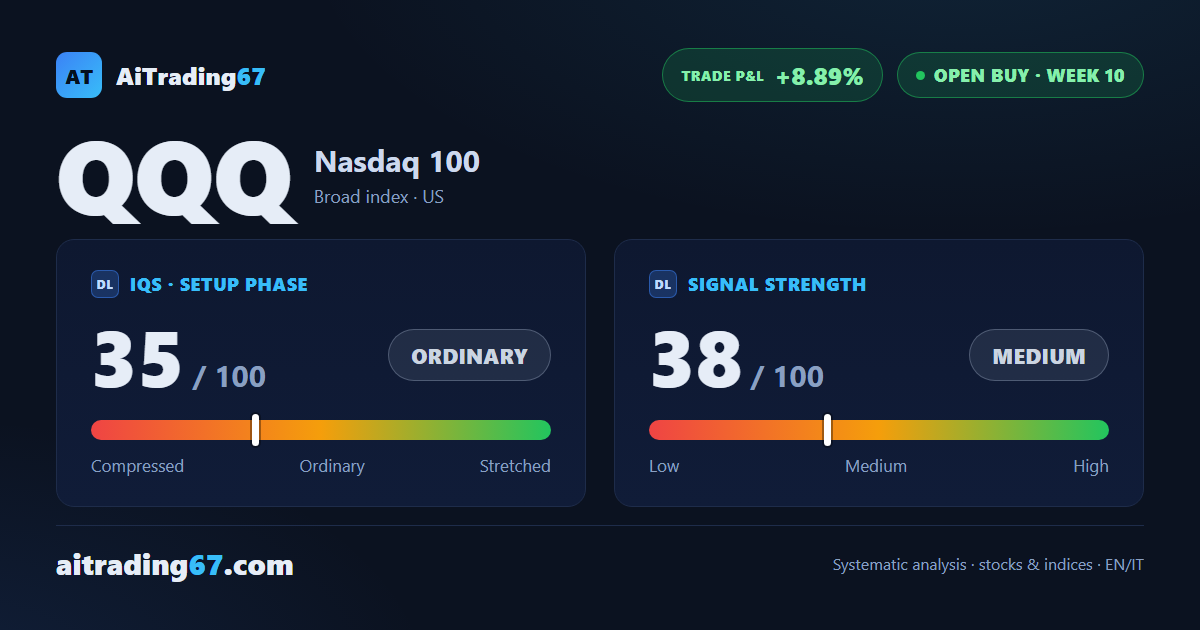
Nasdaq 100 weekly technical analysis: week 10 of a buy setup, +8.9% performance and just below the all-time high. The weekly structure holds, but signal strength cools to 38 of 100 and price action shows the first cracks in buyer participation.

Nasdaq 100, the rally holds but the engine slows: week 10 at +8.9%
Nasdaq 100 · open buy, week 10
Nasdaq 100, the rally holds but the engine slows: week 10 at +8.9%
June 26, 2026
Nasdaq 100 · open buy, week 10
In Summary
The Nasdaq 100 is in week 10 of an open buy signal, up 8.9% from entry and just below the all-time high (about 6% away). The weekly structure stays solid and technology, over half the basket, does the pulling. But signal strength cools to 38 of 100 and price action shows the first cracks: buyer dominance is fading. A mature picture, not a reversal.
Open BUY ·10th week from start ·US Broad indices ·T1 ★ See Gold version →
IQS Phase
35
ordinary
Signal Strength
38
medium · weak
ATH distance
5.96%
5.96%
KPI 4
0/3
Trade P&L %
+8.89%
from signal to today
Chart · Weekly — EMA50 · MACD · VWAP
Weekly chart · EMA50 · MACD · VWAP · Source: TradingView
How to read this pageA visual guide to the post, card by card
The full analysis, operating plan and detailed levels on this asset are reserved for clients★ PLATINUM
restricted Platinum content
Macro context and entry

The macro backdrop is mixed, with two fronts worth reading apart. On the volatility side, the VIX has climbed back into the attention zone, sharply higher over the past month: the options market is starting to ask for more protection. In favorable territory, by contrast, are the MOVE, which gauges bond-market stress, and the SKEW, a sign that protection against sharp drops is not expensive. Breadth — how many stocks are truly taking part in the advance — is in the attention zone and retreating: the rally leans on a narrower crowd. The dollar holds in favorable territory, while gold, oil and the Baltic Dry are all in critical territory after double-digit declines over the last four weeks, a sign of a softening macro floor on the commodities side.

The basket is dominated by technology, which alone weighs over half the total (50.5%). Communication services follow at 16.1% and consumer cyclicals at 12.6%. Every other sector — defensives, healthcare, industrials, utilities, materials, energy, financials, real estate — adds up to just over 20%. Such a concentrated composition amplifies every move in technology: its strength is the real engine of the signal, and any fatigue there is the first risk to watch.

CD1D inverted
B
Solid
Confirmation week W+1
N/A
n/a
Setup quality
Not applicable (US)
Macro Regime
Green
Favourable picture
Technical structure

The weekly structure stays bullish. The four structural moving averages are aligned, price works above the Ichimoku cloud, and the RSI at 60.7 sits in an orderly strength zone, far from extremes. The ADX at 24.3 points to a trend that is present but not in full expansion. There is, however, an early signal not to dismiss: the MACD histogram is deteriorating, down to 6.2, and Bollinger at 0.72 places price in the upper half of the range, no longer at the edge. The distance from the 50-week moving average remains wide, over 13%, marking an extension that invites caution rather than enthusiasm.

The daily adds shades of caution. Here the RSI drops to 46.5, below neutral, the ADX at 21.4 is weak, and money flow is slightly negative, with contained buyer participation (just above 29%). On the daily chart a robust double bottom formed in the 691 area, with an intermediate rebound of 9% — a technical base that held and relaunched price higher.

The review of recent weeks confirms the engine is slowing. The MACD histogram has drawn a steady descent: 10.6 → 9.4 → 9.3 → 6.2. The trend of the moving averages is stable and price never closed below the 200-week moving average over the analyzed period, a sign that the underlying structure is still intact. Weekly price action is neutral, though, with two attention signals: buyer dominance is collapsing and the latest bar shows sellers markedly in control. The Objective Structural Distance (DSO) reads 44, with price less than 6% from the all-time high: the index is approaching recent highs, where the typical tension between an upside breakout and a rejection builds.

DLPrice Action · Last 4 weeks
struttura neutra (2 segnali di attenzione su 9 componenti)
Score60/ 100

Constructive weekly reading but with two attention signals: the structure deserves close monitoring.

⚠ Attention signals (2)
PA8 · buyer dominance collapsingPA9 · sellers extremely dominant in the last bar
Daily pattern Double bottomStrong

Double bottom in the 691 area with an intermediate rebound of 9%.

Reference levels: 686.37 · 695.25
DLIQS · Setup phase
35/ 100
ordinary
compressed · accumulationordinarystretched · mature
3-week slope: ↓ -1.2
DLSignal Strength38 / 100
38/ 100
Medium
low · fadingmediumhigh · compelling
medium · weak
DLNo-Trade Zone
No-Trade Zone · operational range Zone shaded by prevailing regime
close
618.26
814.94
701.13
732.07
DLDistance from all-time highs5.96%
44/ 100
Moderate headroom
limited · near highsordinaryample · clear above
Distance from ATH: 5.96% · Tests on highs (last 10w): 0
Confirmation week

Regime under evaluation: no confirmation candle to observe.

Operational plan and levels

The No-Trade Zone (NTZ) is active and price sits just above its lower threshold, in the 706 area, inside the caution band drawn around the weekly Reversal Point. The primary scenario stays long: this is a buy already underway, not a fresh entry. Stop levels are anchored to structure, with SL1 in the 701 area on the weekly Reversal Point; a second-level stop is not available, so protection is single-level. On the short side the mirror levels remain listed for completeness, but they do not describe the picture: the read is bullish.

On the management front, the first of three scale-out windows has already passed: at the 6th week the model suggested trimming 10% of the position, a threshold now cleared. Remaining are the 11th week, now close, with a further 20%, and the 17th with 30%; the remaining 40% is residual capital left to run. These are discretionary management references, not automatic exits.

The overall picture is that of a mature, in-profit trade, up 8.9% from entry. Signal strength cools to 38 of 100: the advance is still valid, but the cycle's momentum is in an advanced phase and participation is thinning. With the next scale-out window at the door and the first signs of fatigue on price action, discipline suggests favoring active management of the gain already earned rather than chasing new highs.

Indicative profit-taking areasPartially reached
reached
Area 1 · +13.79%
722.46754.16
week 6 · trim 10%
Area 2 · +13.14%
706.52761.74
week 11 · trim 20%
Area 3 · +38.68%
872.18927.40
week 17 · trim 30%
Plus a residual 40% of capital left to run with a trailing stop.
Management progress · 17w window
Week 0 · entry TODAY · W10 Week 17 · area 3

Scale-out roadmap: at the 6th week the model suggested trimming 10% of the position. Remaining: the 11th (20%), the 17th (30%); the final 40% is residual capital left to run. Discretionary management references, not automatic exits.

DLSupport & Resistance
Resistances
719.26Day20-day moving averagerejected 3× · 22/06 · broken 2× · 15/06+1.80%
745.45Day7-day highrejected 3× · 22/06+5.51%
748.65all-time high+5.96%
Supports
702.81Day7-day lowrejected 3× · 22/06-0.53%
698.90Day50-day moving averagerejected 3× · 22/06 · broken 1× · 30/03-1.08%
686.37Day30-day lowrejected 1× · 30/03-2.85%
672.78Week20-week moving averagerejected 2× · 13/04 · broken 2× · 30/03-4.78%
634.91Day200-day moving averagerejected 2× · 06/04 · broken 1× · 30/03-10.14%
624.32Week50-week moving averagerejected 2× · 06/04 · broken 1× · 23/03-11.63%
Operational levelsTrade P&L +8.89%Opened April 17, 2026

LONG

Entry
648.85
SL1
701.13
SL2
N/A
omitted
reached
TP1 · W6
722.46 – 754.16
+13.8%
TP2 · W11
734.13
+13.1%
TP3 · W17
899.79
+38.7%

SHORT (alternative scenario)

Entry
701.13
SL1
734.27
SL2
739.79
TP1
666.62
4.92%
TP2
656.96
6.30%
Legend of recurring termsclick to expand
IQS PhaseSetup Quality Indicator (0-100): descriptor of the index's phase relative to its volatility norm. Toward 0 = compressed/accumulation · ~50 = ordinary · toward 100 = stretched/mature. Descriptive, not predictive.
Signal StrengthCalibrated 0-100 indicator, re-modulated weekly. For buy signals it is the probability that the weekly signal reaches the first target without hitting the Stop Loss: high value = compelling bullish scenario. For sell signals it measures the amplitude of the signal week's drop: high value = very sharp drop, which may signal exhaustion rather than continuation.
CD1D invertedDaily directional compression classifier, re-read for indices in inverted key (Band A = depressed structure = ideal setup, opposite of stocks). Applicable to US indices.
Setup qualitySetup grade at trade opening. Full open · Selective open · Operation not advised · Watch/Skip. The index continues to be analysed weekly anyway.
Macro RegimeSynthetic state of the US macro context read on 8 indicators (VIX · MOVE · SKEW · BPSPX · DXY · GOLD · OIL · BDI). GREEN favourable · YELLOW attention · RED critical.
Inversion PointWeekly structural level fixing the Stop Loss reference. For a buy signal it is below entry; for a sell signal it is above entry.
No-Trade ZonePrice band where entry is not immediately operational. When NTZ is active trading is suspended inside the zone; entries become valid above the upper extreme (long) or below the lower extreme (short).
Profit-taking areasThree time-based scale-out windows (6th, 11th and 17th week from entry): the model suggests banking 10%, 20% and 30% of the position, while the remaining 40% is residual capital left to run. Each window tracks price until its week arrives, then freezes at that week's closing price — so reached is a calendar fact, not a price one. The badge is green when the window is in profit, amber when it froze below entry (at a loss); the level is shown as a band (± daily ATR). Overall card state: NOT REACHED · PARTIALLY REACHED · ALL REACHED. Discretionary management references, not automatic exits.
Index exit gateIn our analysis framework, a weekly sell signal on Broad indices has two distinct purposes. (i) For those already long on the index, closing the trade no longer triggers immediately but requires a 3-week confirmation: price must drop at least 6% from the signal close, or the signal candle must already show that drop vs the previous week. If neither happens, the flag expires and the long trade continues normally. (ii) For those evaluating a bearish entry, the sell signal is the opening read of a new short trade.
W+1 exit noticeEditorial caveat appearing when a running bullish trade records a strongly bearish weekly candle in the first week after entry (W+1 BEAR). Signals attention on the trade's evolution.
Distance from highsPercentage distance from the all-time high (ATH) and tests on highs frequency over last 10 weeks. Close to ATH = limited running room; wide distance = room before first significant ceiling.
Support & ResistanceThe technical levels above (resistances) and below (supports) the index price: moving averages, Bollinger bands, Ichimoku cloud (Kumo), historical highs and lows. Each level shows recent tests — how many times over the last ~5 months price reached it and was rejected (grazed, clean touch or decisive rejection) or broke through it (breakout/breakdown), with the date of the latest episode. More rejections = a more solid wall; a recent breakthrough = the wall has fallen.
IQS Slope (3 weeks)The direction of the IQS Phase over the last three weeks: whether the setup's tension is rising, falling or staying flat. It helps tell whether the index is approaching a stretched/mature phase or unwinding, beyond the point-in-time IQS value.
Trade start dateThe week the current signal opened. Together with the percentage gain since start, it shows how long the trade has been running and where it sits along the management path (scale-out windows).
Disclaimer — The content on this page is published for educational and informational purposes and represents the author's personal opinion and technical analysis. It is not financial advice, a solicitation to invest, or personalised recommendation. Trading financial instruments involves significant risks and may result in the loss of all or part of the invested capital. Every operational decision is the sole responsibility of the user, who acknowledges acting in full autonomy and full awareness of risk.
Share WhatsApp Telegram Gmail LinkedIn