
The global macro backdrop is mixed but not hostile. The VIX is in the attention zone, sharply lower over the past 4 weeks: expected volatility has deflated, a sign of a market that has regained composure. The MOVE is in favorable territory, as is the SKEW: protection against sharp drops is not expensive, the market is not pricing acute fear. Breadth measured by the BPSPX stays in the attention zone though improving, while the dollar is also under observation. On the commodity front the tone is heavier: gold, oil and the Baltic Dry are all in critical territory, with crude sharply lower. It is a context that keeps financial stress at bay but signals a slowdown in the real cycle.
The basket is dominated by the technology sector, which alone weighs over half of the total. Communication services follow at 16% and consumer cyclicals at 13%. All the other segments — defensives, healthcare, industrials, utilities, materials, energy, financials, real estate — carry a combined weight below 20%. This concentration in technology amplifies the index's sensitivity to the breathing of the large growth names: it is the engine of the rally, but also the first point of fragility if momentum fades.
The weekly structure is still constructive. The four structural moving averages are aligned, the price stays above the Ichimoku cloud, and the RSI at 61.8 works in strength territory without pushing into extremes. The ADX at 23.7 describes a trend that is present but not in full expansion. The MACD, however, is deteriorating, and the 13.5% distance from the EMA50 tells of an already wide extension relative to the medium-term average. Bollinger bands place the price in the upper part of the range, consistent with a market hugging its highs.
On the daily the picture turns cooler. The price holds above the 200-day moving average and above the Ichimoku cloud, but the RSI at 48.1 is neutral, the ADX at 17.6 signals no clear direction, and the negative CMF points to outflows rather than accumulation. A double bottom emerged in the 695 area, with an intermediate rebound of 9% that gave the index some breathing room: a strength pattern, but on a base of weak participation.
The review of recent weeks is the signal to read most carefully. The MACD histogram has entered a continuous decline: 9.45 → 9.25 → 6.24 → 4.15. Momentum is compressing week after week, though it remains in positive territory. The moving-average trend is stable and the price never closed below the weekly EMA200 in the analyzed period — the underlying structure has not been breached. Weekly price action, however, is bearish with 5 warning signals out of 9 components: contracting volumes, mixed rejection bars, an indecisive last bar and collapsing buyer dominance. The structural reference lows sit in the 686 area and the 703 area. The price operates hugging the all-time high, with little room to run before the next resistance: the immediate constraint is the high itself.
Weekly reading with 5 attention signals: the structure shows fragility on components.
Double bottom in the 695 area with an intermediate rebound of 9%.
Regime under evaluation: no confirmation candle to observe.
The No-Trade Zone (NTZ), the price band where the model discourages new entries, is active. The stop levels are anchored to the weekly structure: SL1 coincides with the weekly Inversion Point, while the second stop level is omitted and protection stays single-level. The reference targets remain available in the dedicated card; the operational picture, however, is no longer that of an entry but of an advanced trade to be accompanied.
The scale-out windows describe the moment in the cycle well. The first, at the 6th week, and the second, at the 11th, are now behind: the model's discipline suggested taking a first and a second fraction of the gain at the price of those moments. The third window remains open, expected later on, while the residual portion of the position can continue with the trailing stop on the Inversion Point. These are management references at the trader's discretion, not automatic exits.
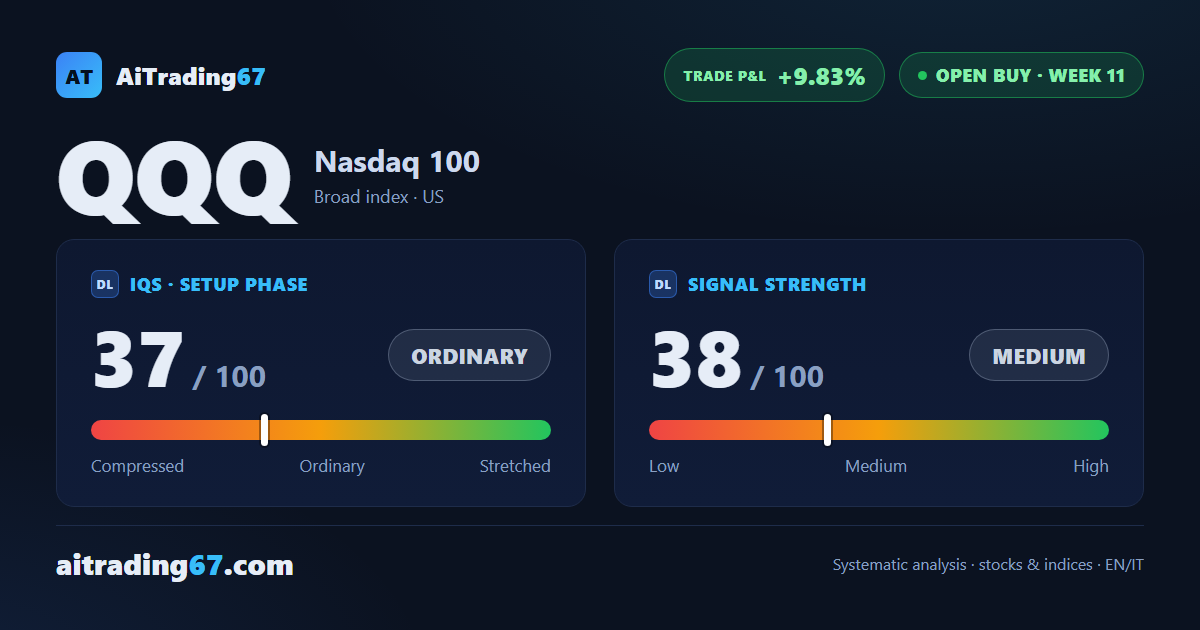
The overall picture is that of a mature bullish trade, not a reversal. The buy signal has been active for 11 weeks and runs at +9.8% from entry, but Signal Strength recalibrates to 38 out of 100: the uptrend is still standing, yet momentum has moved past its expansion phase. A falling MACD histogram, cooling weekly price action and outflowing daily flows converge on the same message. The underlying signal is not compromised, and these elements remain caveats to monitor rather than exit signals; but the balance between residual strength and reversal risk, with two scale-out windows already passed, shifts the reading toward active management of the trade rather than a reinforcement of the position.
Scale-out roadmap: at the 6th week the model suggested trimming 10% of the position; at the 11th week the model suggested trimming 20% of the position. Remaining: the 17th (30%); the final 40% is residual capital left to run. Discretionary management references, not automatic exits.
LONG
SHORT (alternative scenario)