
Nasdaq 100 · weekly sell signal
QQQ (Nasdaq 100): a sell signal fires, but the downside push stays weak
Nasdaq 100 · weekly sell signal
Our view last week
The QQQ, an ETF tracking the Nasdaq 100, pulls back from its record just as the drive fades: in this week's technical read, at week 13 of a buy signal the gain eases from 11.81% to 7.16% and price slips to a touch below 8% from the all-time high. A daily double bottom in the 687 area cushioned the drop with a 9% rebound, but the weekly shows a MACD histogram pinned near zero and price action turned lower. A mature uptrend, to manage with care.
This week's summary
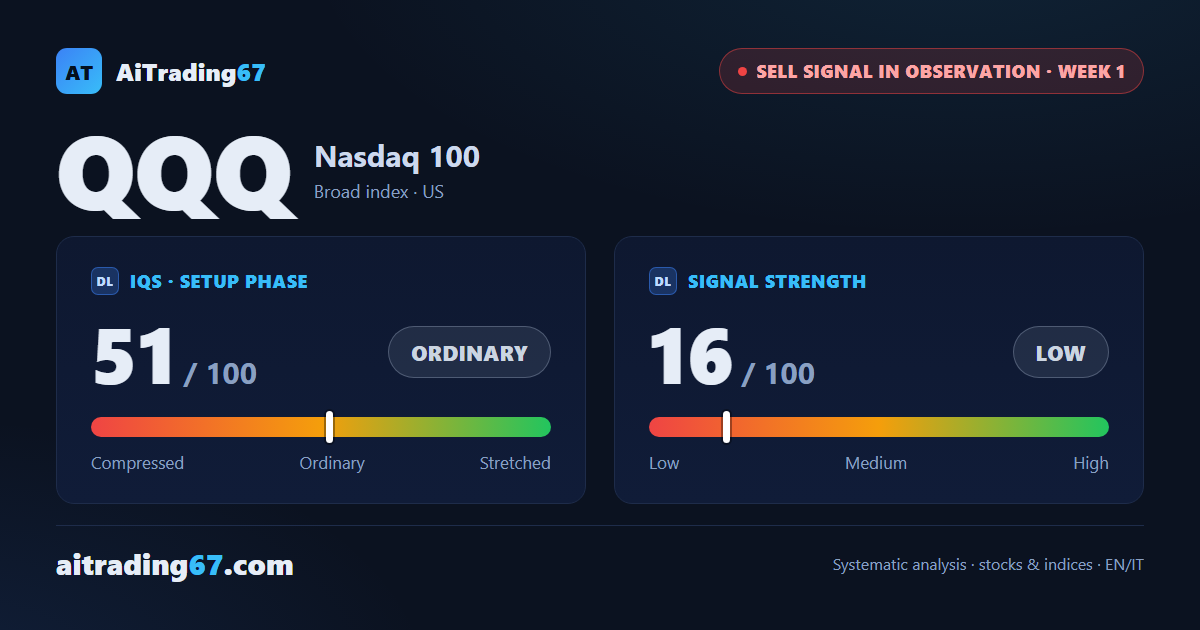
The QQQ, an ETF tracking the Nasdaq 100, flips to sell: after 13 weeks of buying, a fresh weekly signal fires. The MACD histogram, pinned near zero seven days ago, has slipped into negative territory and price action confirms the turn — aggressive sellers into the close, buying at the lows. Yet the pressure stays weak, and on the daily a double bottom in the 685 area has already bounced 4%. Weekly technical analysis of QQQ puts the new sell signal under observation.
IQS Phase
51
ordinary
Signal Strength
16
low · fading
ATH distance
9.41%
9.41%
KPI 4
0/3
restricted Platinum content