
How to read an analysis — Index (sell)
How to read the post · Index · SELL signal (downtrend)
How to read a downside index analysis
Same cards as the upside index, but read in reverse: the primary scenario is the decline. A few things change — the colour, the reading key, and some blocks appear/disappear. We go through them one by one.
Real example used throughout this guide: QQQ (Nasdaq 100), during the decline of March 2026.
Before you start — everything you read are hypotheses and readings according to our model, not rules to follow. Every trader operates in full autonomy and assumes their own risk.
Section visible to everyone
Block 1
In Summary
The week's prose summary for the index in decline.
Public
Real example — QQQ
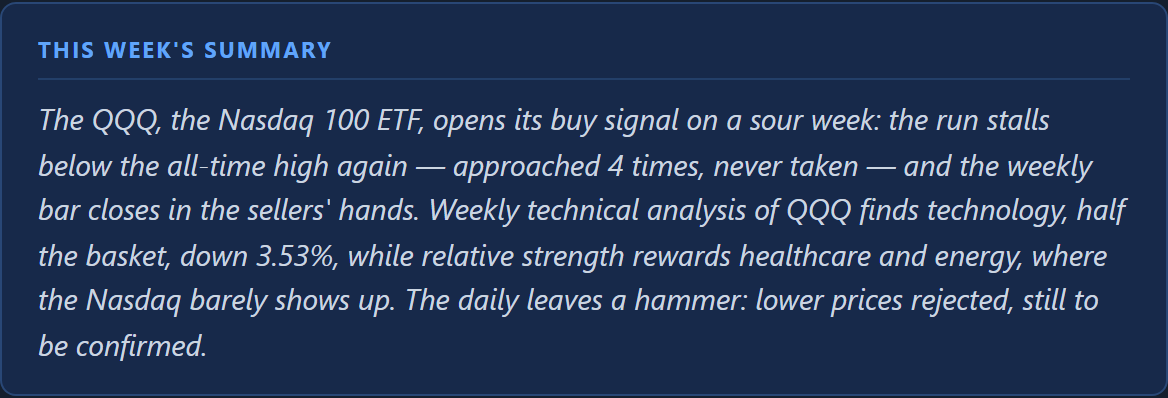
The starting point: state of the sell signal, context and the reading of the moment. As with stocks, on a decline that has lasted several weeks it becomes a technical reading more than a new signal.
Block 2
Hero strip — the status row
The at-a-glance row at the top of the post.
Public
Real example — QQQ

The sell signal status, how many weeks it's been active and the category (Broad index). The compass is the colour: here it's red = downtrend scenario (on the upside index it's green).
Block 3
KPIs — the key numbers
The summary measures, read in a bearish key.
Public
Real example — QQQ
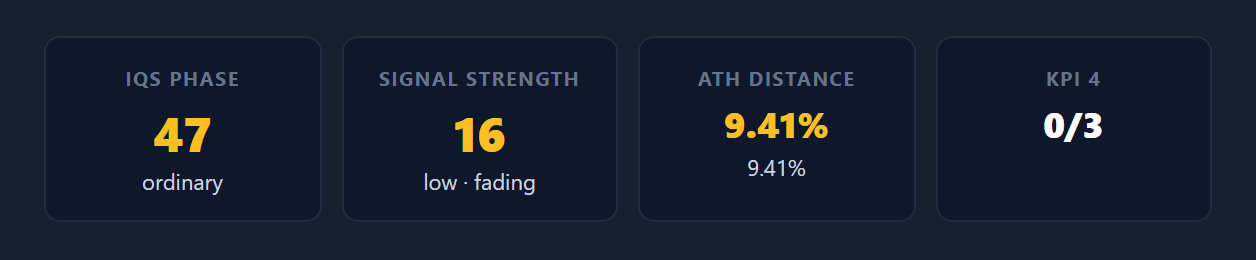
- IQS · Setup phase (0-100) — the setup's phase. Descriptive, not predictive.
- Signal Strength (0-100) — on declines the other way around: high = a very strong drop, possible exhaustion.
- Distance from ATH — distance from the all-time high (it widens in a decline).
- A fourth value for context.
- Trade P&L % — on a decline, a falling price is a gain. It is calculated with no stop loss applied: the trade is left to run, meets its targets along the way and closes only when the signal reverses. Had you exited at one of the stop levels we flag, your own result would differ.
Like the upside indices — no "Sizing"/"Ranking": indices aren't ranked like stocks.
Block 4
The chart
The index's weekly chart.
Public
Real example — QQQ
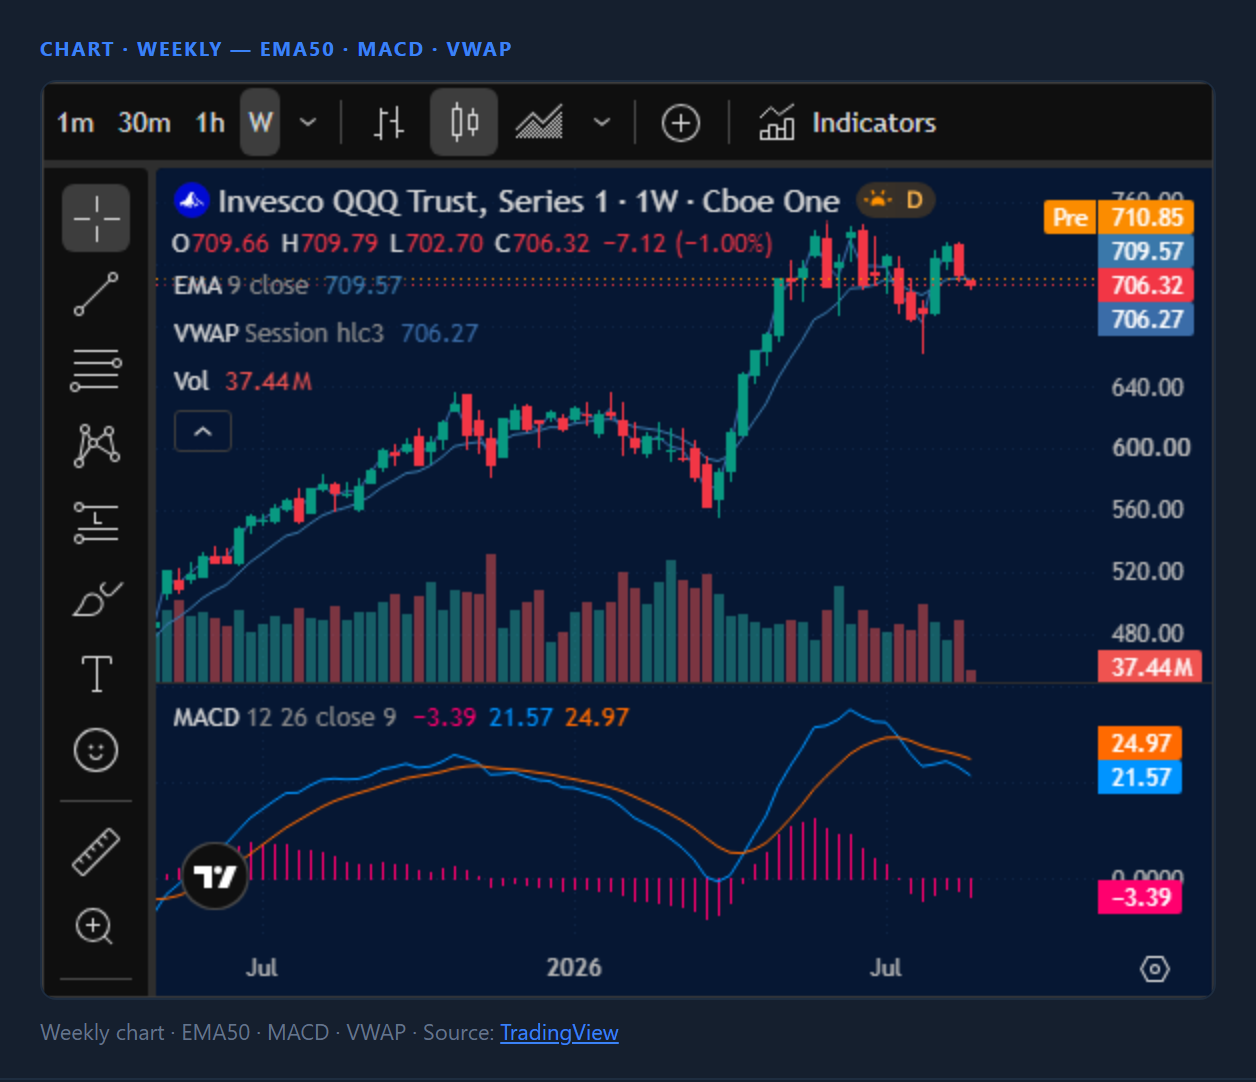
Weekly chart (50-period MA, MACD, VWAP) — a TradingView widget (for some assets it might not be there). Last block visible to everyone: below, the "How to read this page" link; then the analysis is reserved for Platinum.
Section reserved for Platinum clients
Block 5 · prose
Macro context and entry
The first editorial paragraph.
Indices only★ Platinum
Real example — QQQ
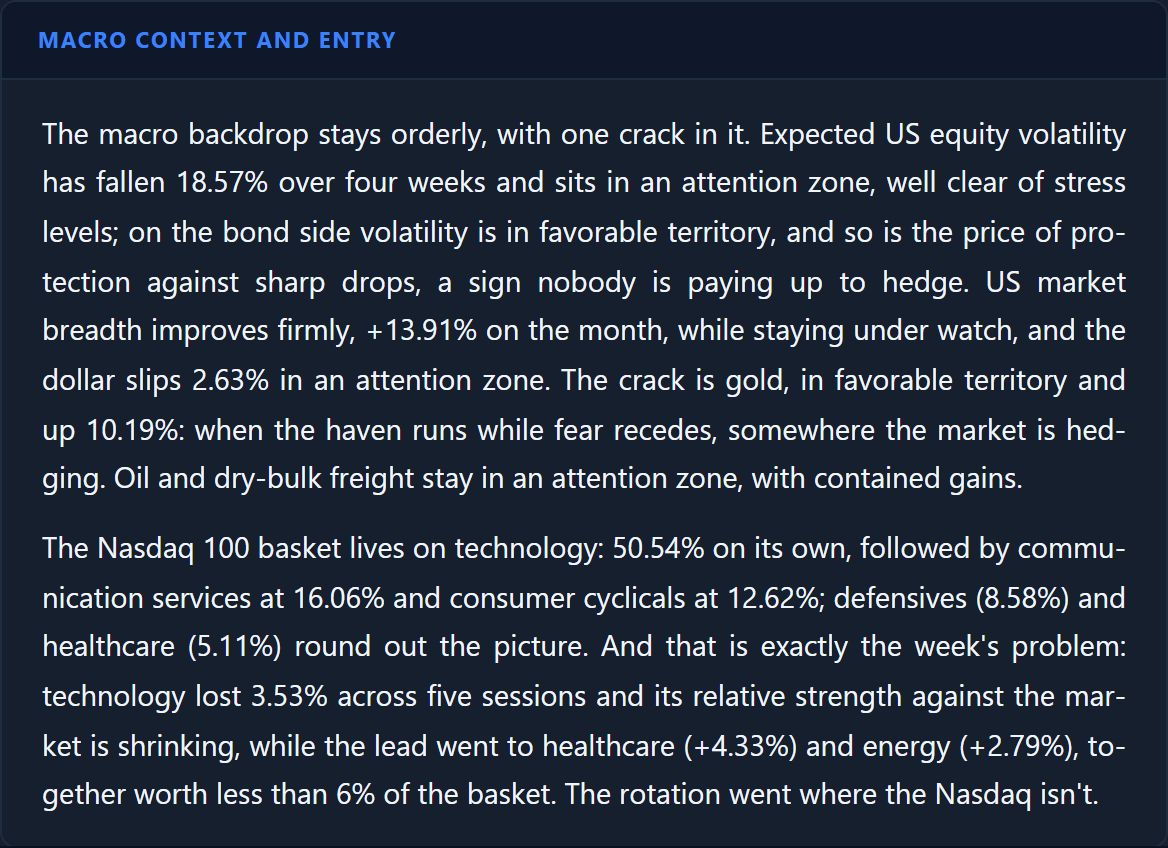
As on the upside, the index post alternates cards and prose. This paragraph frames the macro context and the entry of the sell signal.
Block 6
Macro hero
Four background indicators for the index.
Indices only★ Platinum
Real example — QQQ

The four cells: CD1D inverted (structure — on indices it reads the opposite of stocks), Confirmation week W+1 (confirmation), Setup quality band (setup grade), Macro Regime (market regime). In a sell scenario the picture leans toward red.
Block 7 · prose
Technical structure
The second editorial paragraph.
Indices only★ Platinum
Real example — QQQ
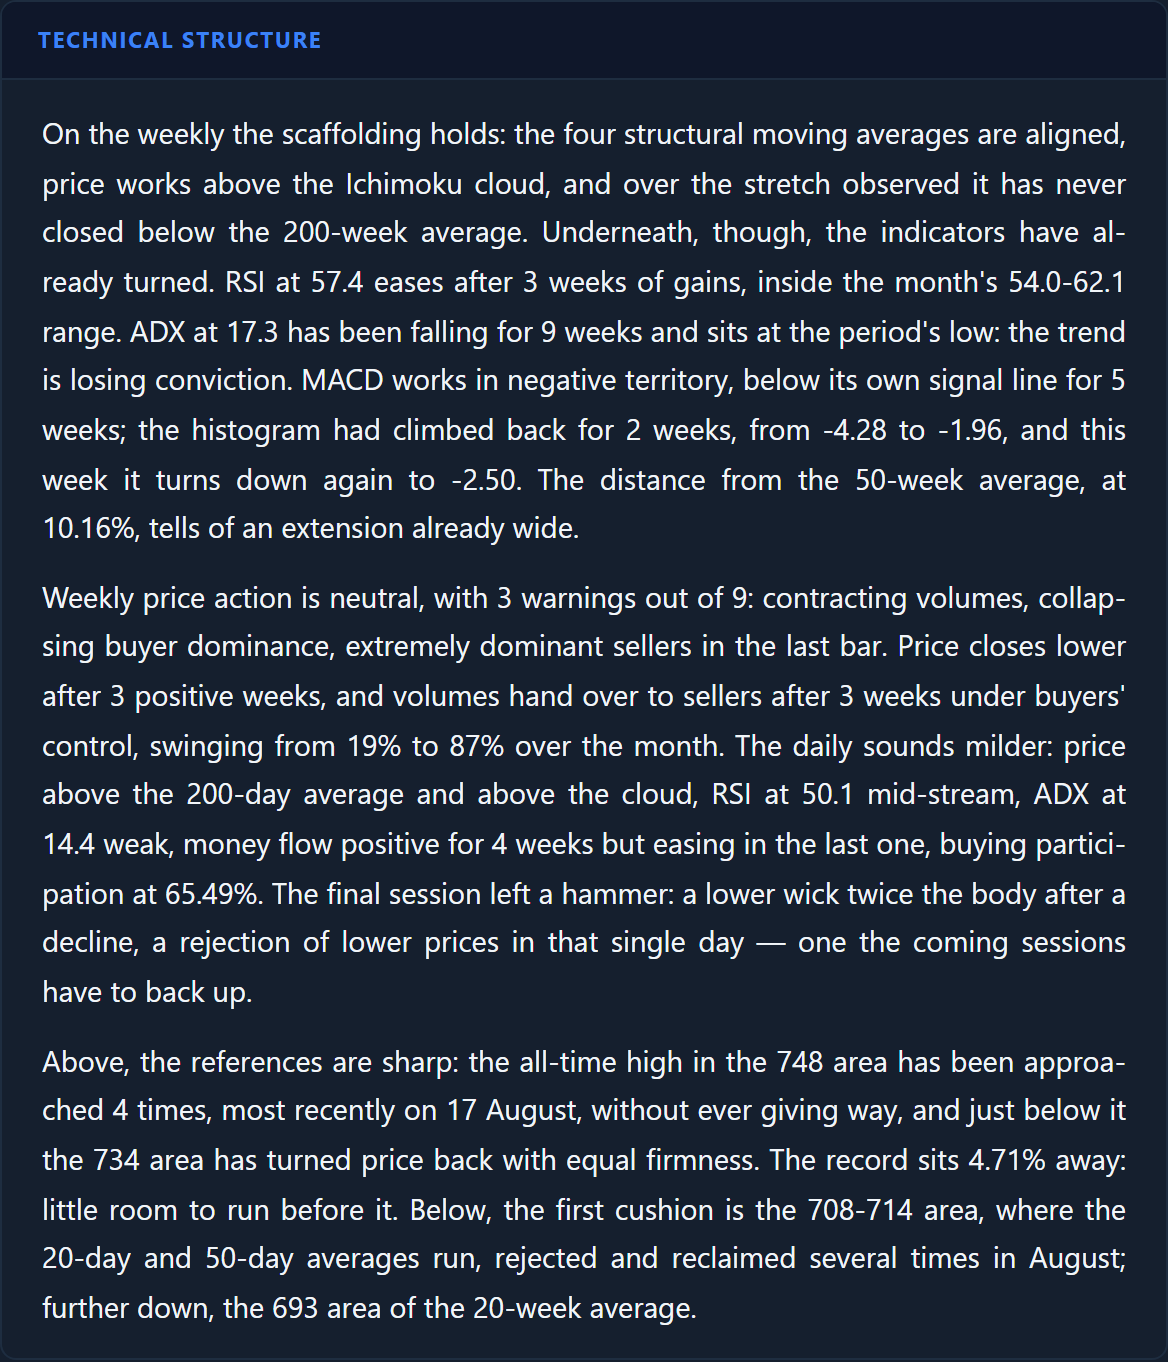
The account of the index's technical structure in the decline week. When present, the Sector composition and — on sell signals under observation — the Exit gate can also appear here (see below).
Block 8
Price Action
The reading of the price over the last four weeks.
★ Platinum
Real example — QQQ
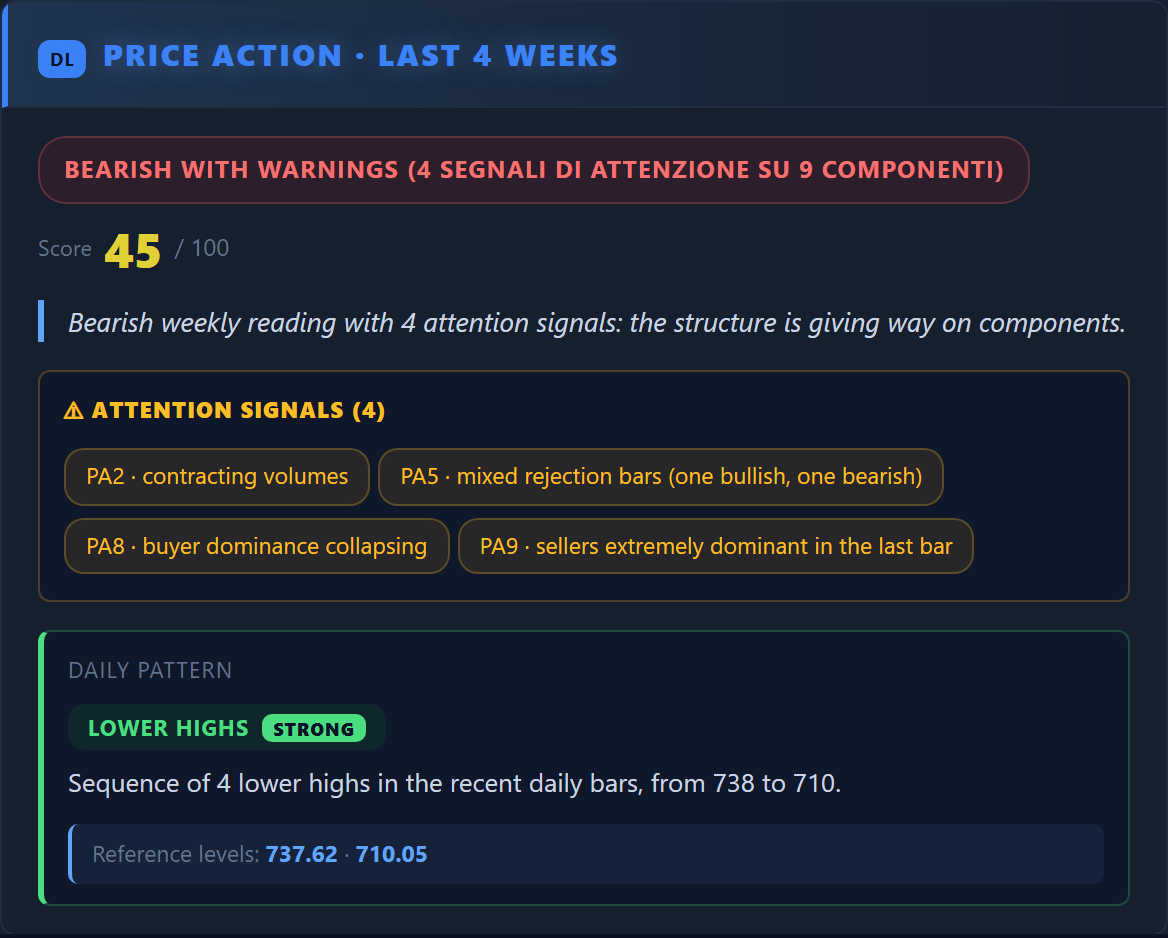
What the price is doing over the last four weeks: direction, patterns, strength of the move (with a score) and warning signs.
Blocks 9-12
The proprietary indicators
Four measures from the model, one per card.
★ Platinum
IQS · Setup phase
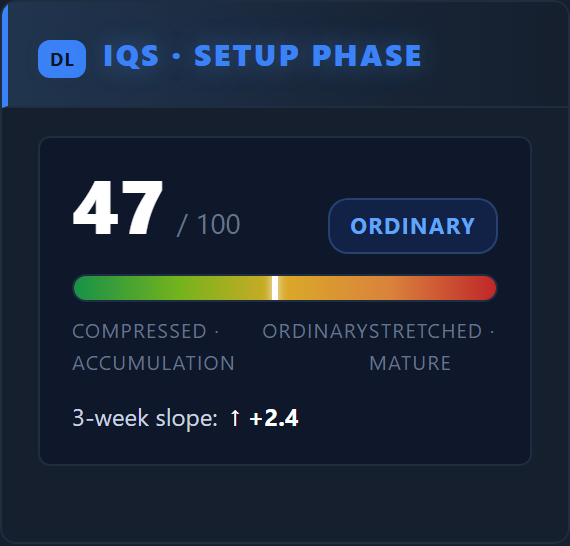
A phase descriptor of the setup (compressed → stretched/mature). Descriptive, not predictive.
Signal Strength
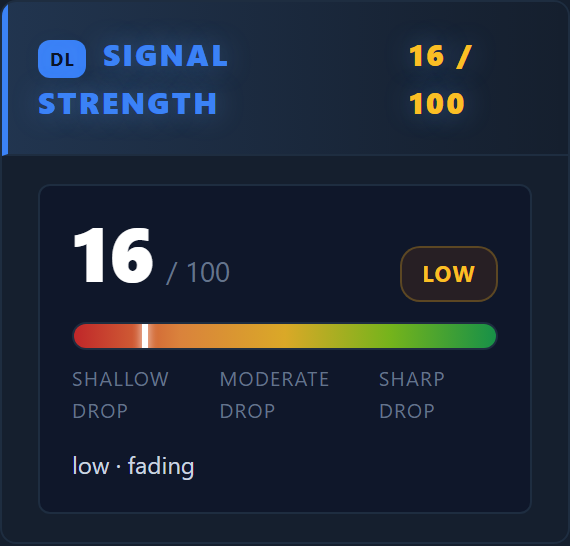
On declines the other way around: high = a very strong drop, possible exhaustion rather than continuation.
No-Trade Zone
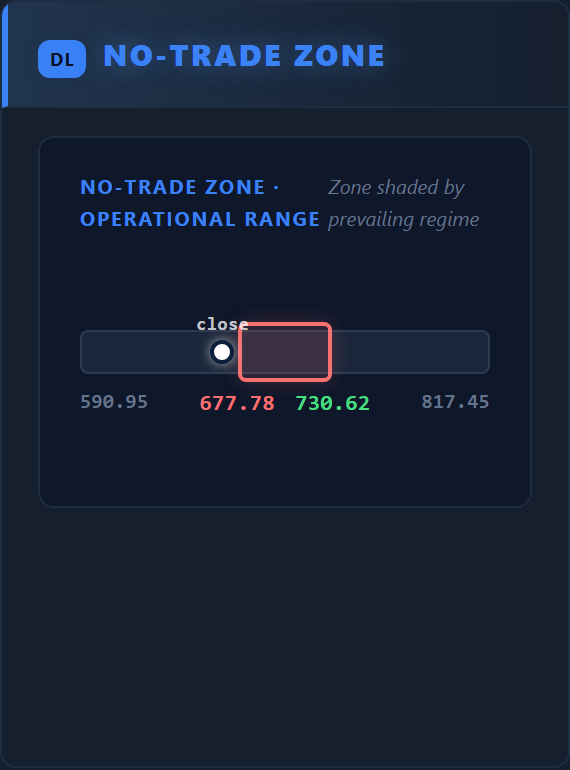
A band around the Inversion Point where entry is not operational; on an operational decline it's valid below the lower extreme. The dot is the side of the regime, without a value.
Distance from all-time highs
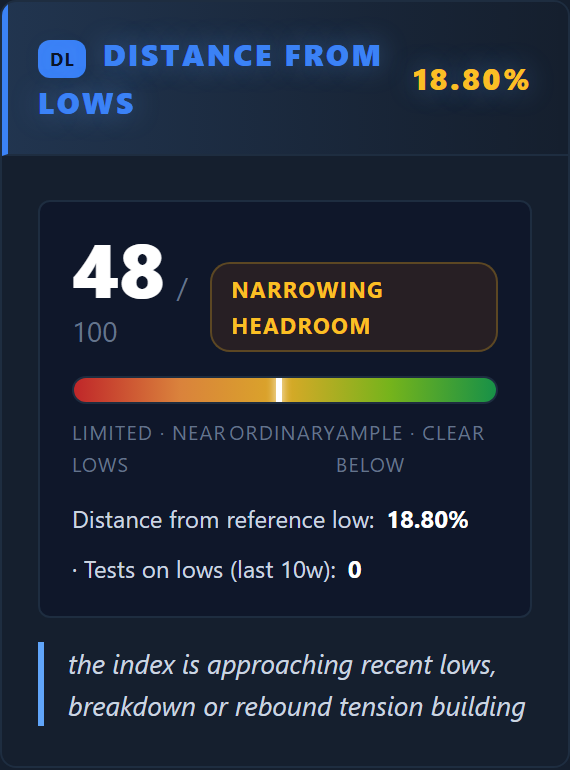
How much margin there is between the index and its highs: in a decline the distance widens.
Support & Resistance
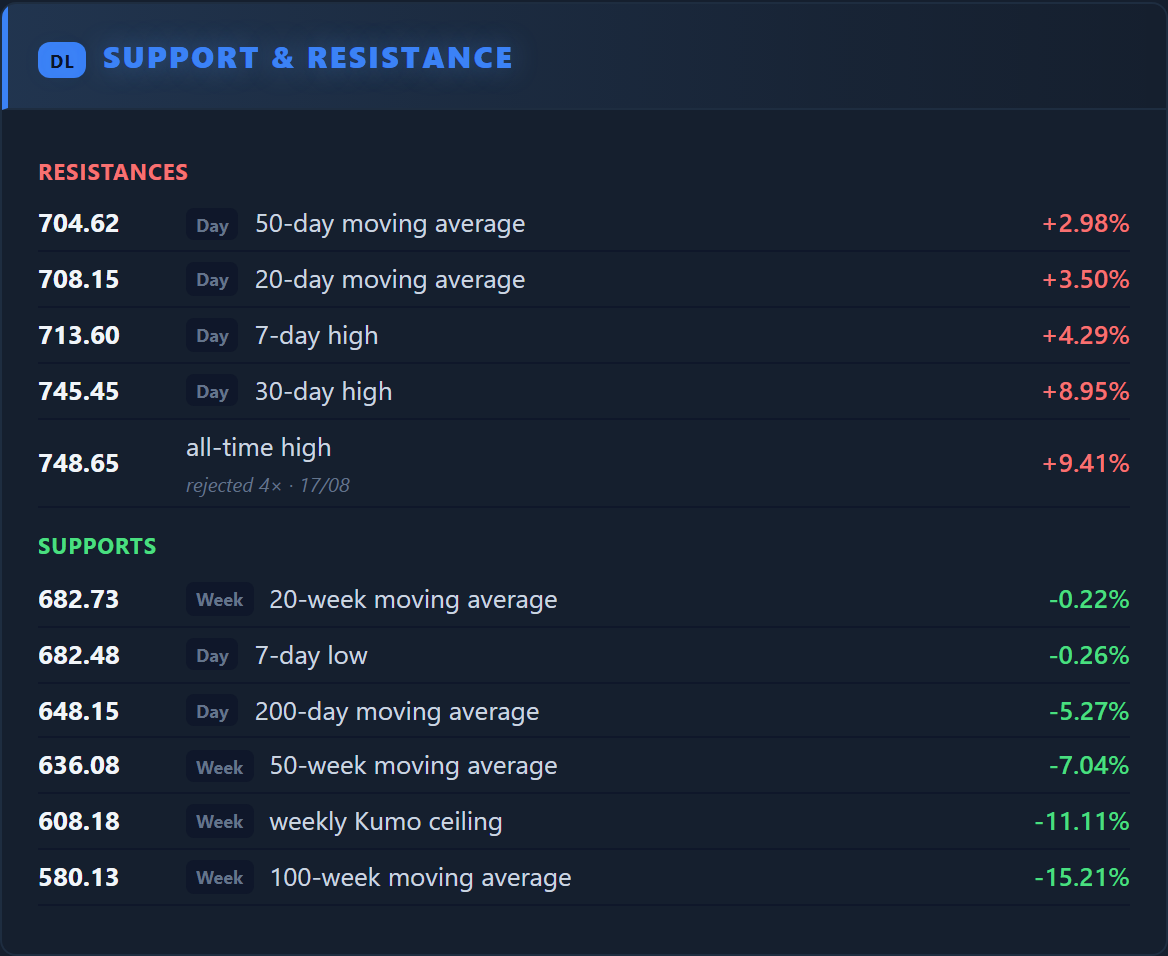
The levels the price meets above (resistances) and below (supports): for each one the price, the timeframe it comes from (Day or Week), what it is — a moving average, the Ichimoku cloud, an all-time high — and its distance from price. The «rejected N×» or «broken N×» note says how many times that level has been tested, and when last: a level rejected several times is sturdier than one never tested.
Block 13
Confirmation week
The check on the week after the signal.
★ Platinum
Real example — QQQ
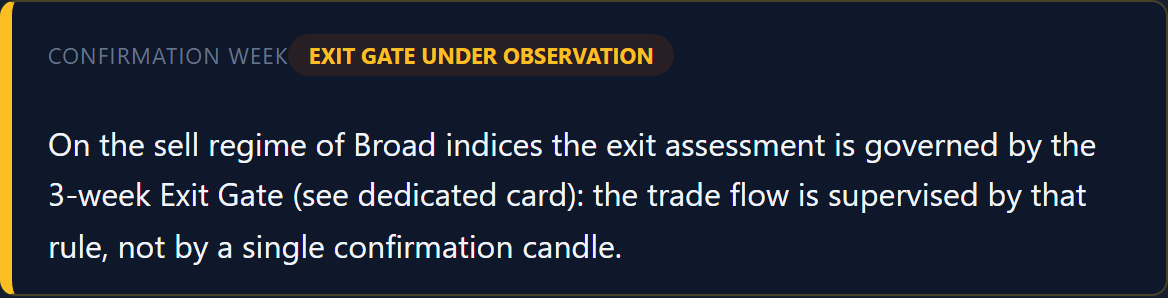
It checks the signal one week after it starts (confirmed or reversed). On indices it always appears.
Conditional block
Sell signal exit gate
Appears only on index sell signals, in the first weeks of observation.
Indices only · SHORT only★ Platinum
When an index enters a sell, the model opens a 3-week observation window to check whether the decline confirms or reverses. In those weeks the Exit gate appears, reporting:
- Signal date and observation weeks (e.g. 2 / 3).
- Return from the signal and weeks left before expiry.
- Close confirmation threshold and distance from that threshold.
- A 3-week timeline (signal → today → expiry).
Note — in this example the Gate isn't shown (the case was reconstructed from historical data without the observation history). In a live published post, on index declines in the first weeks, the card appears in this position.
Block 14 · prose
Operational plan and levels
The third editorial paragraph, which introduces the levels.
Indices only★ Platinum
Real example — QQQ
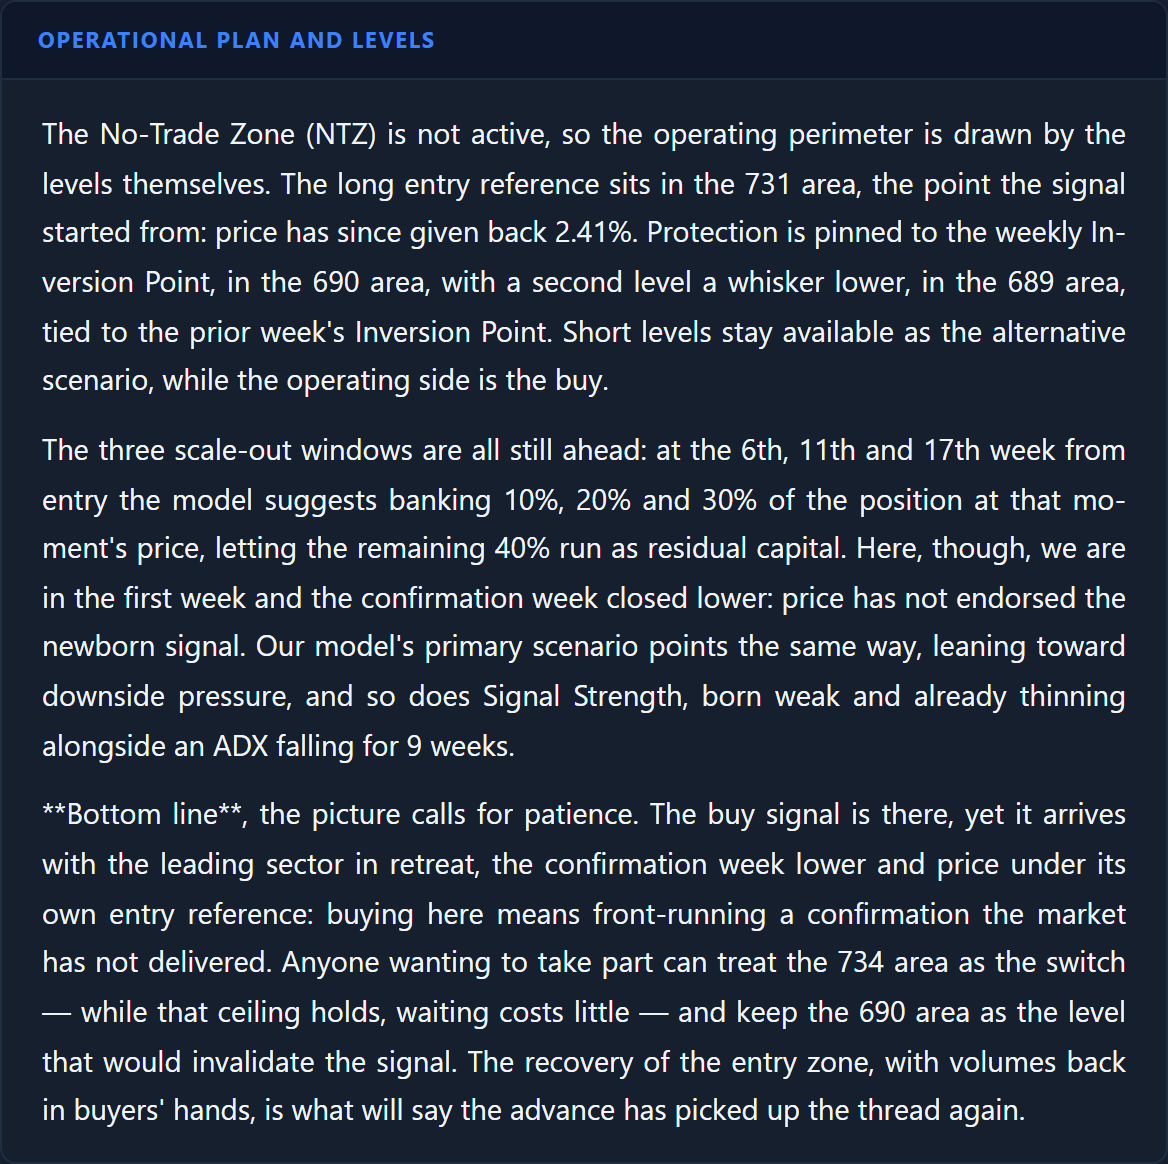
The account of the operational setup on the short side. A working hypothesis, not instructions.
Block absent on declines
Take-profit areas
On upside indices there's the profit-taking areas card here. On declines it doesn't appear.
LONG only
On a falling index this card is not shown: the index model doesn't include profit-taking areas on the short side. Management stays tied to the Inversion Point and the evolution of the signal.
Block 15
Operational levels
The numeric grid — here with the SHORT as the primary scenario.
★ Platinum
Real example — QQQ
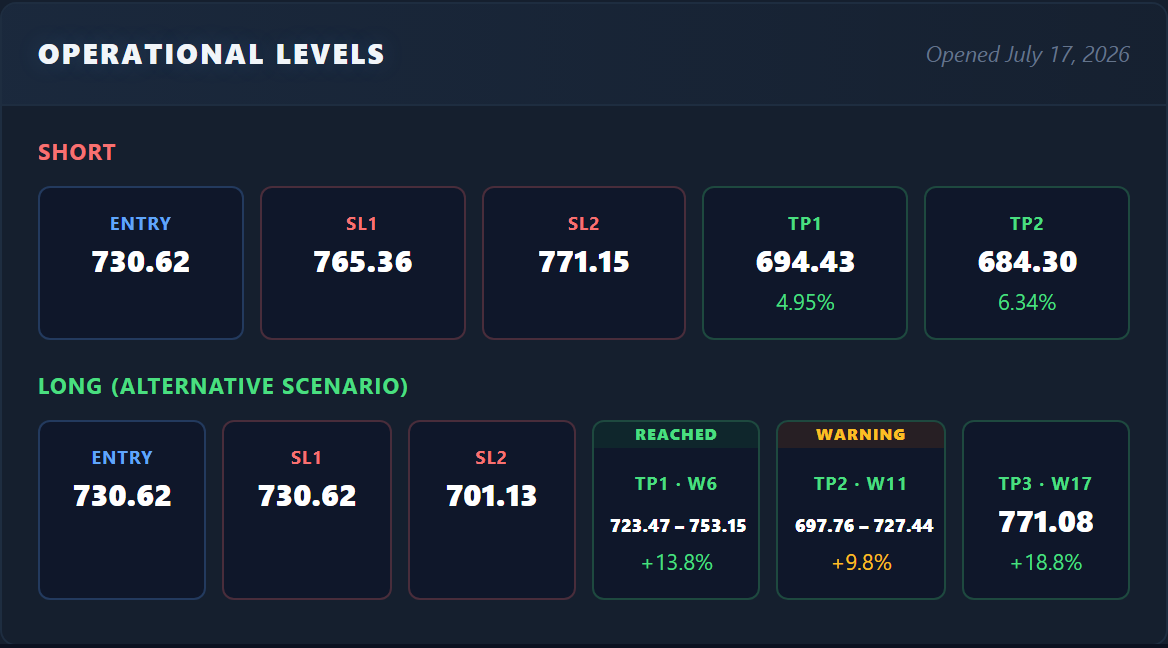 1
2
1
2
1SHORT (primary)
On sell posts the SHORT grid is the main one: Entry, SL1/SL2 protection (above entry) and the TPs downward. Stops are options, not instructions: it is up to you whether to use one, which one, or none. If price closes the week beyond one of the stops flagged in the previous card we call it out in the summary and in the trading plan, along with the result anyone following that level would have taken (only weekly closes count, not an intraweek touch). The model itself does not close the trade: it keeps tracking the stock until the signal eventually reverses.
2LONG (alternative scenario)
Below, the LONG scenario as service information (here not populated). (On upside indices the hierarchy is the opposite: LONG primary.)
Important — model levels, not orders to execute. The operation is yours and at your own risk.
Block 16
Previous analyses
The history of the same index.
★ Platinum
Real example — QQQ
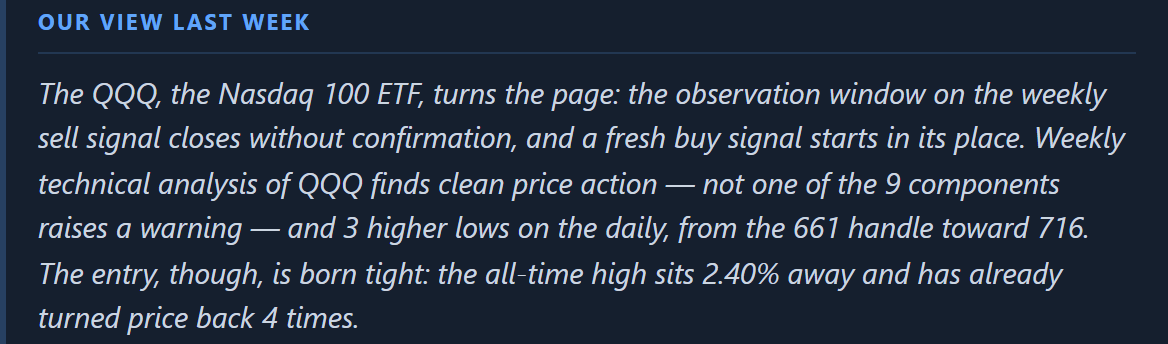
The links to previous analyses of the same index, to follow its thread over time.
Block 17
Legend
The glossary of terms, with the index-specific entries.
★ Platinum
Real example — QQQ

It explains the page's terms (including the index-specific entries). Here you'll also find the "How to read this page" link.