
Ferrari: week 4 of a buy signal, +7.9%
Ferrari closes flat (0%) as price squeezes between two averages near its highs
Ferrari: week 4 of a buy signal, +7.9%
Our view last week
Ferrari is in week 3 of an open buy, already running at +7.92% since entry. The confirmation week closed bullish and the model's discipline points to strengthening the position, but signal strength is still modest and the stock only ranks 35th among the 62 open buys in European-UK stocks. Price sits between its nearest reference levels, with earnings coming in three-four weeks, on July 30.
This week's summary
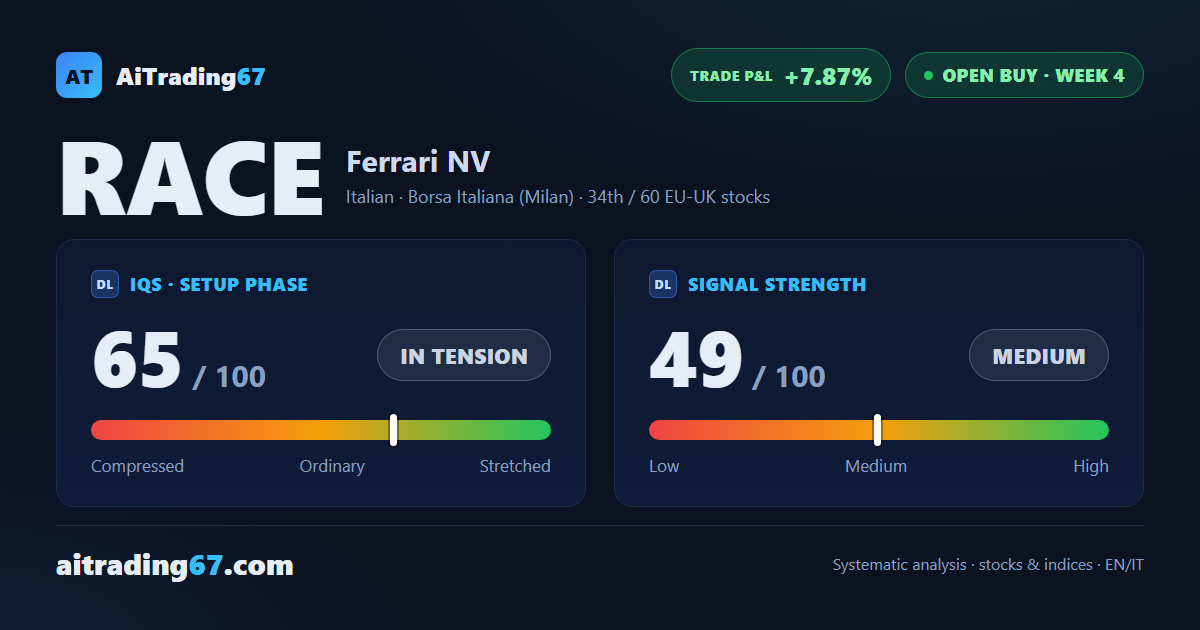
Ferrari closed the week essentially flat, squeezed into a very tight band between the daily pivot average, in the 331 area, and the 50-week average just below, in the 329 area: tension is building toward its recent highs. Ferrari stock is in week 4 of an open buy signal, already up 7.9% with the first of the model's three price targets hit. This week's technical analysis flags two caveats though: fading candle-body conviction and sellers slightly ahead.
IQS Phase
65
in tension
Signal Strength
49
medium · weak
Sizing
REDUCED
Ranking
#34 / 60
EU-UK stocks in progress
Trade P&L %
+7.87%
from signal to today
restricted Platinum content