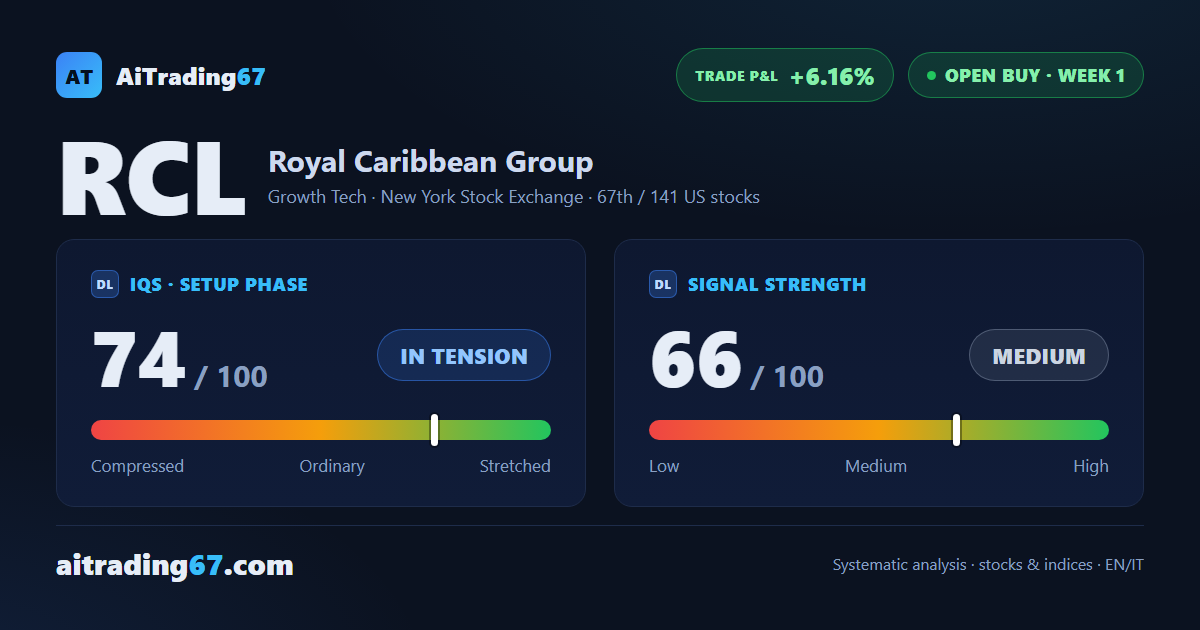
Royal Caribbean · buy signal confirmed
Royal Caribbean: positive opening week, the model suggests adding exposure
Royal Caribbean · buy signal confirmed
In Summary
Royal Caribbean Group opens its buy signal with a first week already up 6.16%. The weekly technical structure is intermediate bullish, with all structural moving averages aligned and the price above the Ichimoku cloud. Volatility is elevated, however — a signal strength of 66 out of 100 describes a wide move — and room before historical resistance is limited: medium conviction, to be managed with discipline.
IQS Phase
74
in tension
Signal Strength
66
medium
Sizing
STANDARD
Ranking
#67 / 141
US stocks in progress
Trade P&L %
+6.16%
from signal to today
restricted Platinum content