
Royal Caribbean: a soft week, stop already secured
Royal Caribbean slips 3.7% as the double bottom holds and the stop stays at breakeven
Royal Caribbean: a soft week, stop already secured
Our view last week
Royal Caribbean is in week 3 of a buy signal, with signal strength at 70 out of 100: high conviction, but on a wide and volatile stock. The stop has already moved to breakeven and the first-week confirmation closed positive. The stock ranks 41st among the 125 open buys for US stocks, with earnings approaching in three-four weeks, on July 23.
This week's summary
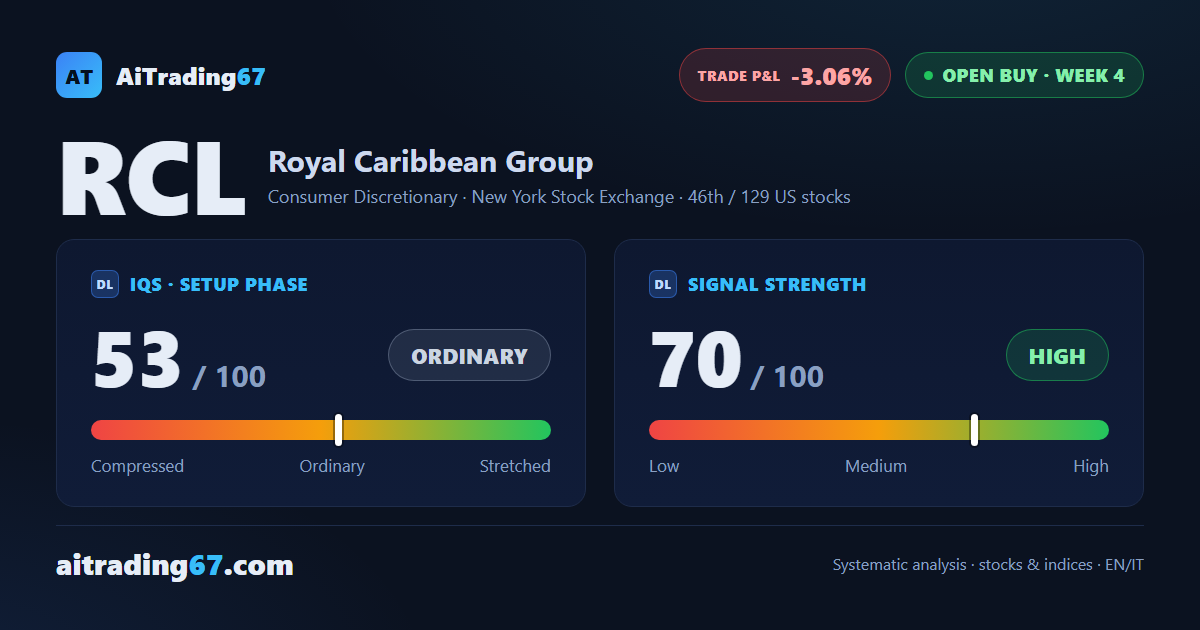
Royal Caribbean slips 3.7% this week, but the double bottom in the 269 area holds and signal strength stays put at 70 out of 100. The weekly ADX stays very low and the MACD is deteriorating, while sellers remain slightly ahead on the daily chart. This swing trading setup now has earnings two weeks out.
IQS Phase
53
ordinary
Signal Strength
70
high · wide & volatile
Sizing
FULL
Ranking
#46 / 129
US stocks in progress
Trade P&L %
-3.06%
from signal to today
restricted Platinum content