
Fresh sell signal right on top of support
Regeneron drops 6.7% and loses its 20-week average as a new Sell signal fires
Our view last week
Regeneron stock rises for a second straight week, +0.4%, yet the weekly price action doesn't back the move: sellers dominated the bar to an extreme degree, with buying below 25% of volume. Price is boxed between the daily Inversion Point average, in the 792 area, and the daily Inversion Point, in the 780 area. Our technical analysis tracks one of the weekly buy signals among US stocks, now +18.6%, with the ADX rising for 8 weeks.
This week's summary
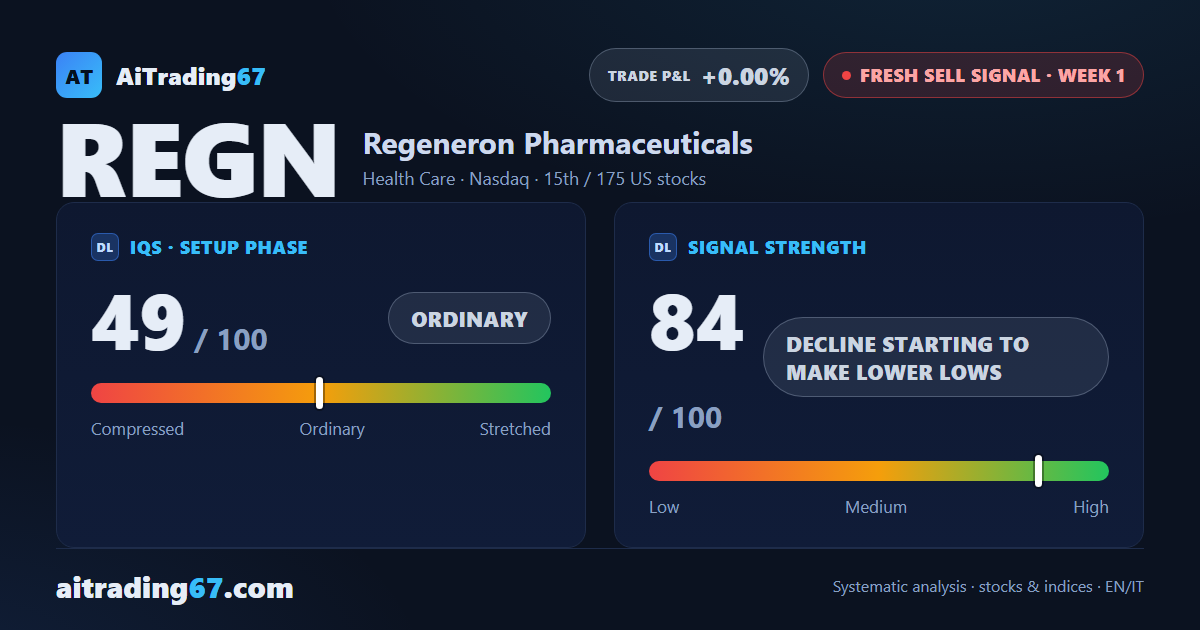
A 6.7% drop in a single week has pushed Regeneron back below its 20-week average, in the 746 area, and fired a fresh Sell signal: a week ago our technical analysis was still tracking a buy. Regeneron stock has stopped, though, right on top of a band of supports, with the 50- and 200-week averages in the 722 area. For our model, opening a short here is high-risk: among US stocks, this is a setup to watch through the confirmation week.
IQS Phase
49
ordinary
Signal Strength
84
decline starting to make lower lows
Sizing
STANDARD
Ranking
#15 / 175
New us stocks
Trade P&L %
+0.00%
from signal to date, no stop loss
Regeneron Pharmaceuticals (REGN) weekly chart — EMA50 · MACD · VWAP
Weekly chart · EMA50 · MACD · VWAP · Source: TradingView
Rank position
ranks 15th among the 175 sell signals for US stocks in our ranking, with a signal strength of 84 out of 100.
Sector context
SectorHealth Care
Benchmark ETFXLV
Sector regimein positive regime
Performanceweekly -2.65% · monthly -3.91%
REGN belongs to the health care sector (reference ETF XLV). The sector is classified in positive regime according to our weekly reading.
restricted Platinum content