
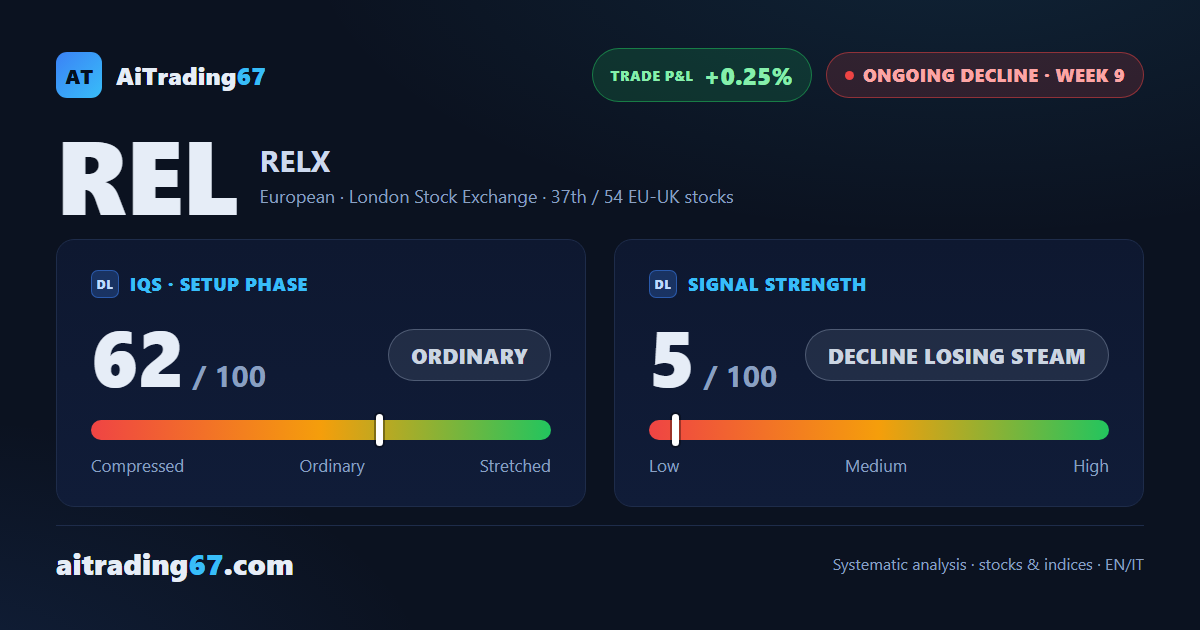
Sell signal bounces, money flow stays cautious
RELX rebounds 3.6% off a double bottom, but money flow is heading the other way
Sell signal bounces, money flow stays cautious
Our view last week
RELX plc is in the 8th week of a sell signal, and the decline keeps making lower lows: signal strength climbs to 21 out of 100, a steady pace rather than exhaustion. The setup quality indicator sits at 71 out of 100, in maturity tension, and the stock ranks 13th among the 54 European sell signals. Price now trades between the first resistance and first support seen on the daily chart.
This week's summary
After three weeks of decline, RELX shares finally paused: this week's technical analysis shows a 3.6% rebound off a clean double bottom in the 2280 area, with a 6% intermediate bounce. Under the surface, though, the picture stays two-sided — money flow keeps worsening and volume stays split — and the short, in its ninth week of management, sits just about at breakeven.
IQS Phase
62
ordinary
Signal Strength
5
decline losing steam
Sizing
MINIMUM
Ranking
#37 / 54
EU-UK stocks
Trade P&L %
+0.25%
from signal to today
restricted Platinum content