
Sell signal, week 4
Rheinmetall slips 2.6% and closes below its 200-week moving average
Our view last week
Rheinmetall stock fell 2.9% in a week run by sellers: buying stayed below 25% of volume in the weekly bar, and the price action points to a distribution phase. After last week's rejected rebound, the Sell signal is heading lower again, and the price is now eyeing its 200-week moving average, in the 970 area. On technical analysis it reads as a decline starting to make lower lows, with trading still not recommended.
This week's summary
Rheinmetall stock fell 2.6% and its weekly close dropped below the 200-week moving average, in the 969 area, the level the price was eyeing a week ago. The week also brought a fresh 30-day low, in the 940 area, confirmed on the close. On technical analysis the Sell signal is gathering pace: price action in a distribution phase, negative money flow, contracting volumes. For swing trading, our model still rates the trade setup as not recommended.
IQS Phase
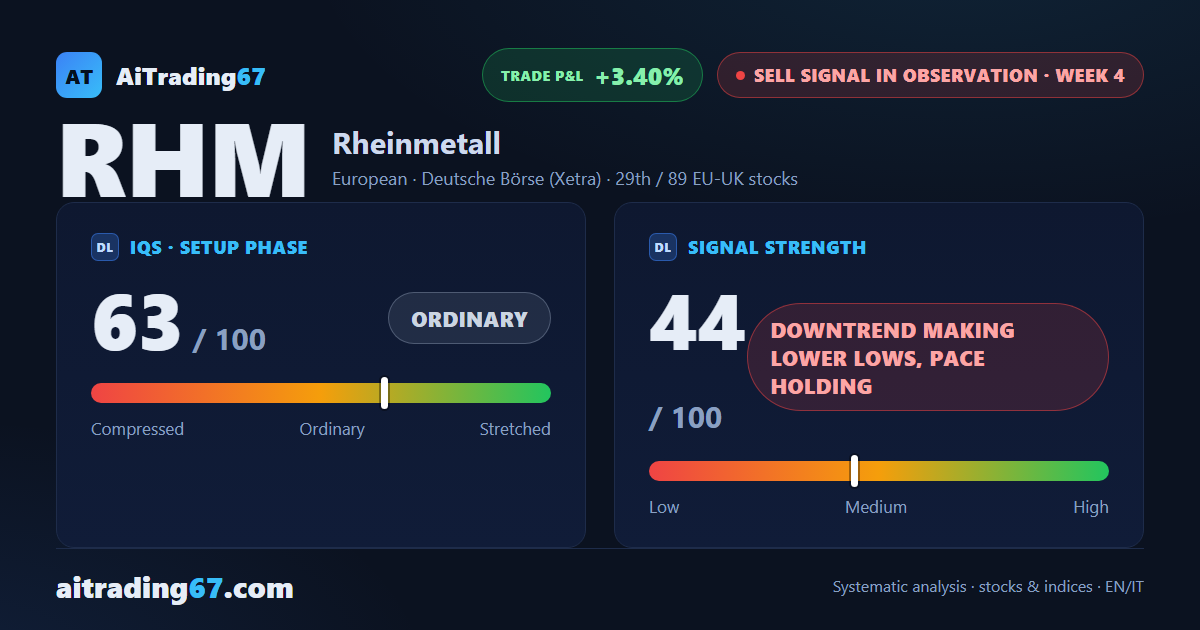
63
ordinary
Signal Strength
44
downtrend making lower lows, pace holding
Sizing
REDUCED
Ranking
#29 / 89
EU-UK stocks sell signals
Trade P&L %
+3.40%
from signal to date, no stop loss
Rheinmetall (RHM) weekly chart — EMA50 · MACD · VWAP
Weekly chart · EMA50 · MACD · VWAP · Source: TradingView
Rank position
ranks 29th among the 89 sell signals for European-UK stocks in our ranking, with a signal strength of 44 out of 100.
Sector context
SectorEuropean
Benchmark ETFEXH4
Sector regimeweak phase
Performanceweekly -0.03% · monthly +0.15%
RHM belongs to the european sector (reference ETF EXH4). The sector is classified weak phase according to our weekly reading.
restricted Platinum content