
Sell signal · week 5 · US stocks
Rigetti Computing drops 8.5% and loses its 100-week average again while tech climbs
Our view last week
For the first time in 13 weeks, weekly money flow on Rigetti Computing has turned positive, and the stock closed up 5.7%, lifted by a sharp bounce off the 20-day moving average in the 16 area. A week ago the rise came on thinning trade; now buyers have led volume for 2 weeks. In this technical analysis of Rigetti Computing stock, a volatile name among US tech stocks, the sell signal is fading out, strength at 2 out of 100, and price action argues against fresh shorts: trading not recommended.
This week's summary
In a week when the tech sector gained 1.8%, Rigetti Computing dropped 8.5% and lost its 100-week average again, in the 16.1 area. A week ago the bounce looked set to switch off the Sell signal; now the decline is back in stride and has handed back nearly all of a 3-week recovery. This technical analysis of Rigetti Computing stock, a volatile name among US tech stocks, finds one counterweight: weekly money flow is positive and improving. Weak price action, contracting volumes.
IQS Phase
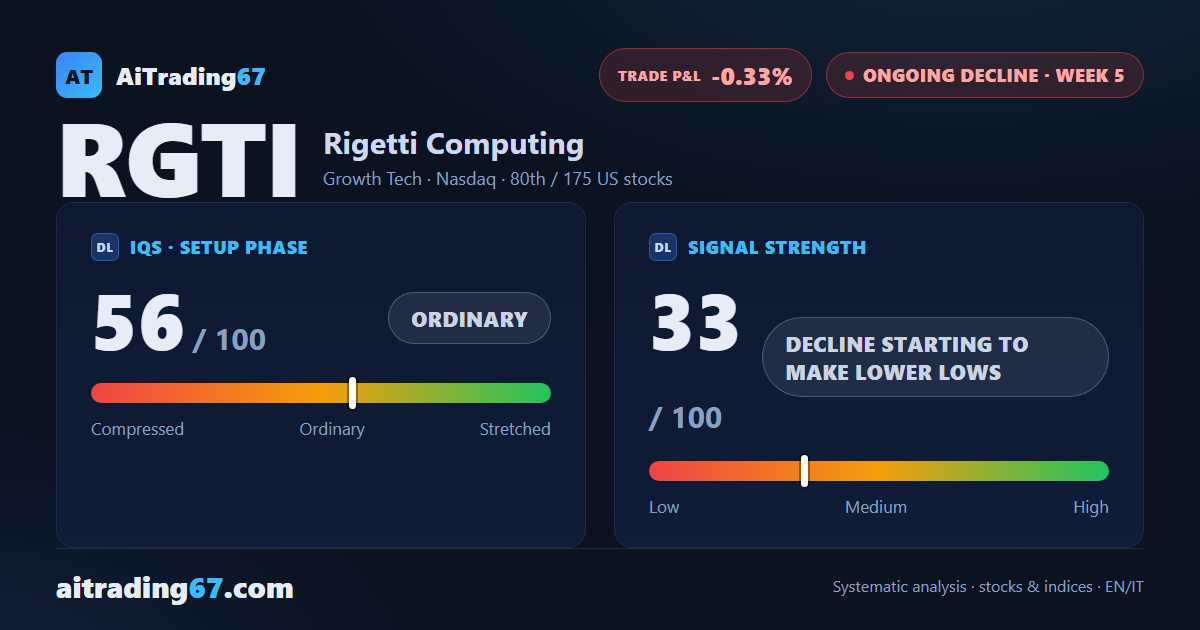
56
ordinary
Signal Strength
33
decline starting to make lower lows
Sizing
REDUCED
Ranking
#80 / 175
US stocks
Trade P&L %
-0.33%
from signal to date, no stop loss
Rigetti Computing (RGTI) weekly chart — EMA50 · MACD · VWAP
Weekly chart · EMA50 · MACD · VWAP · Source: TradingView
Rank position
ranks 80th among the 175 sell signals for US stocks in our ranking, with a signal strength of 33 out of 100.
Sector context
SectorGrowth Tech
Benchmark ETFXLK
Sector regimein strong phase
Performanceweekly +1.80% · monthly +8.83%
RGTI belongs to the growth tech sector (reference ETF XLK). The sector is classified in strong phase according to our weekly reading.
restricted Platinum content