
Rivian's buy signal takes a breather after the rally
Rivian slips 6.2% and stalls between support and resistance, buy signal holds
Rivian's buy signal takes a breather after the rally
Our view last week
Rivian is in its 4th week of a buy signal, with the trade running at +13.94% since entry. Signal strength sits at 86 out of 100 — a wide but volatile move — and the stock ranks 12th among the 125 US stock Longs already running. The setup quality indicator is at 65 out of 100, in a maturity tension phase: the picture stays constructive, with the first active-management window drawing closer.
This week's summary
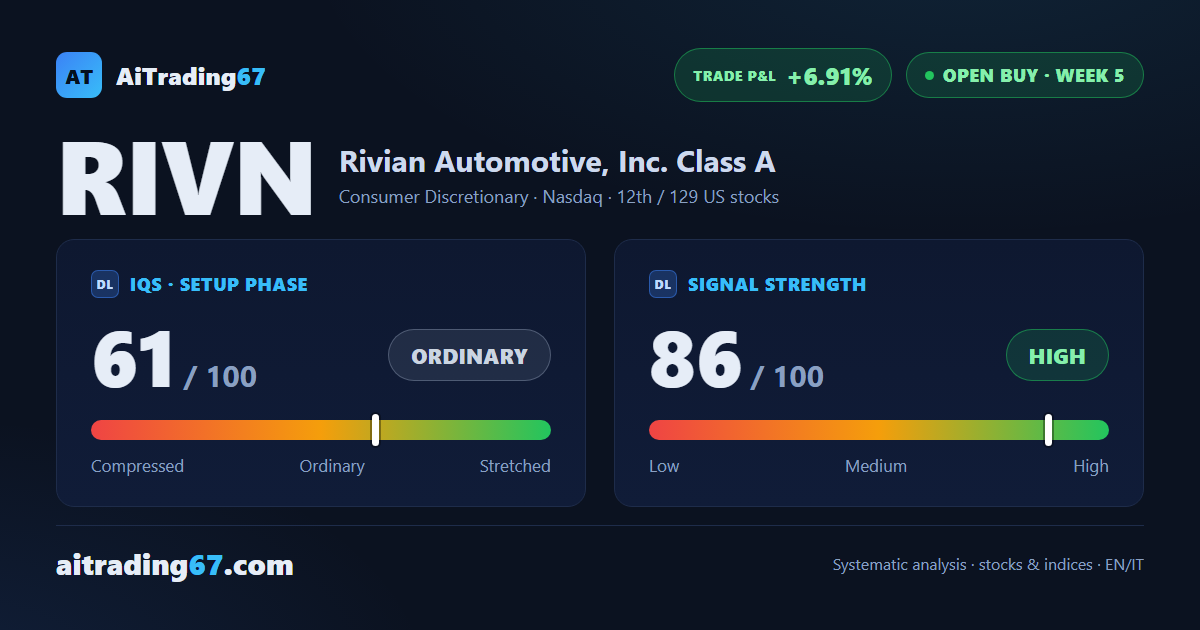
Rivian slips 6.2% this week, but daily money flow stays positive and price is now boxed between the first support and the first resistance, just above the 20-day moving average. Rivian's buy signal remains open, 12th among 129 US Longs, with the trade up 6.91% and the stop already moved to breakeven.
IQS Phase
61
ordinary
Signal Strength
86
high · wide & volatile
Sizing
FULL
Ranking
#12 / 129
US stocks in progress
Trade P&L %
+6.91%
from signal to today
restricted Platinum content