Sell signal · week 2 in observation
RKLB: weekly downtrend confirmed, but setup remains high risk
Sell signal · week 2 in observation
In Summary
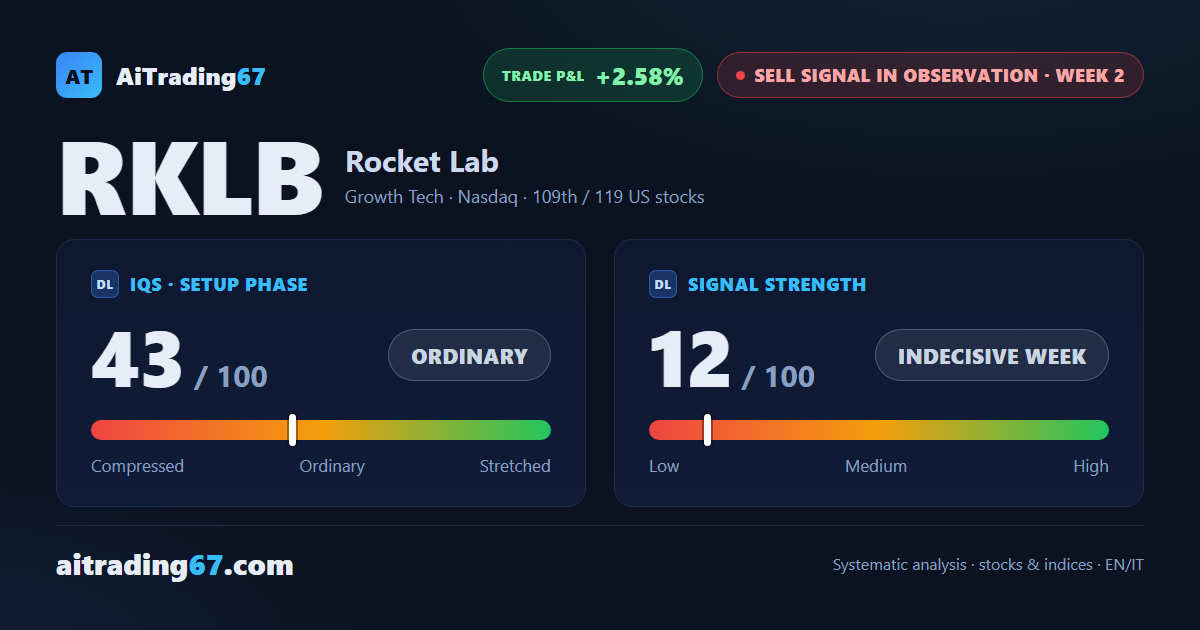
RKLB is at week 2 of a sell signal, with the confirmation week closing bearish. The weekly structure remains in a downtrend, but signal strength at 12 out of 100 describes an indecisive week, not a decisive drop. The quality band flags trading not recommended: the stock trades nearly twice above its 200-week moving average — a condition that makes any new short position high risk per our model.
Sell signal in observation
·2nd week from start
·US stocks
·T2
IQS Phase
43
ordinary
Signal Strength
12
indecisive week
Sizing
MINIMUM
Ranking
#109 / 119
US stocks sell signals
Trade P&L %
+2.58%
from signal to today
restricted Platinum content