
Hermes sell under management: money flow starts to turn
Hermes International closes flat at +0.0%, but money flow starts to turn
Hermes sell under management: money flow starts to turn
Our view last week
Week 23 of the sell signal on Hermes International, and the week closed nearly flat, with buying volume back up to 80%. The technical picture stays more cautious than that alone suggests: volumes are contracting, the last candle lost conviction, and a distribution phase is still underway on the daily chart. The quarterly report is approaching, expected on July 29.
This week's summary
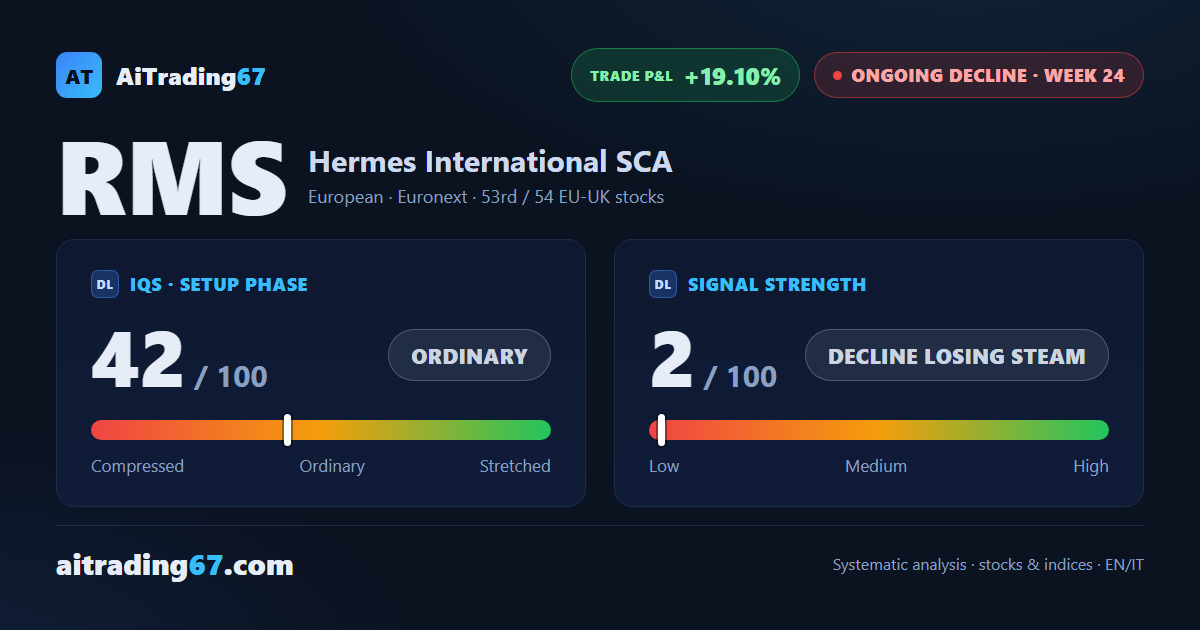
Money flow on Hermes International is starting to turn: after weeks of negative pressure the CMF is climbing and the weekly MACD keeps improving for a third straight week, with buyers still holding 70% of volume. Price stays flat, though, just like seven days ago when buyers had jumped to 80%, and the stock is boxed between two nearby technical levels. This week's technical analysis update tracks whether the stalled Sell signal, now in its 24th week, finally breaks free.
IQS Phase
42
ordinary
Signal Strength
2
decline losing steam
Sizing
MINIMUM
Ranking
#53 / 54
EU-UK stocks
Trade P&L %
+19.10%
from signal to today
restricted Platinum content