
RTX: week 4 of the buy, risk now zeroed out
RTX slips 1.2% as the 177 double bottom holds and the stop moves to breakeven
RTX: week 4 of the buy, risk now zeroed out
Our view last week
RTX shares slipped 1.7% this week, with a weak final bar and sellers slightly ahead — but volume still leans firmly toward buyers and the weekly MACD has just crossed bullish. Versus seven days ago the setup quality indicator has jumped from 69 to 87 out of 100, while signal strength holds steady at 47. Technical analysis of the buy signal, third week of the trade.
This week's summary
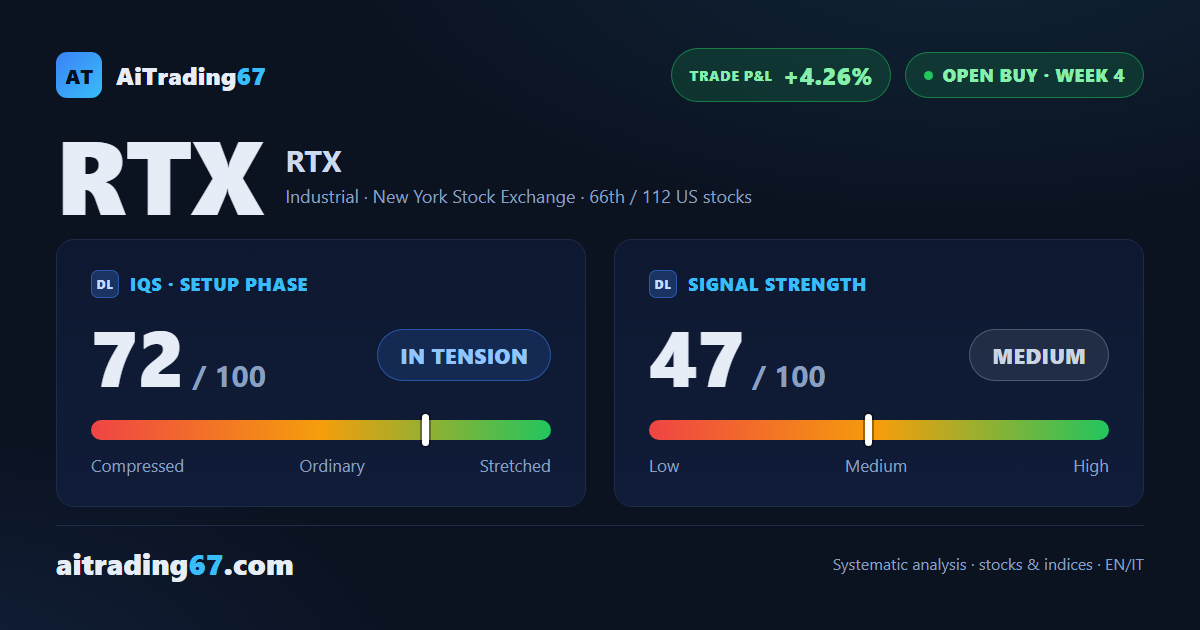
RTX shares slipped 1.2% this week, with a weak final bar and sellers slightly ahead — but the setup traces back to a clean double bottom in the 177 area, with a 5% bounce still standing. Price is now boxed between a support in the 192.6 area and a resistance in the 195 area, while the weekly structure stays bullish and the MACD keeps improving. Technical analysis of the buy signal: the trade is up 4.3% since entry, in its fourth week.
IQS Phase
72
in tension
Signal Strength
47
medium · weak
Sizing
REDUCED
Ranking
#66 / 112
US stocks in progress
Trade P&L %
+4.26%
from signal to today
restricted Platinum content