
RTX surges 10%, near all-time highs
RTX Corporation jumps 10% and closes in on its all-time highs
RTX surges 10%, near all-time highs
Our view last week
RTX shares slipped 1.2% this week, with a weak final bar and sellers slightly ahead — but the setup traces back to a clean double bottom in the 177 area, with a 5% bounce still standing. Price is now boxed between a support in the 192.6 area and a resistance in the 195 area, while the weekly structure stays bullish and the MACD keeps improving. Technical analysis of the buy signal: the trade is up 4.3% since entry, in its fourth week.
This week's summary
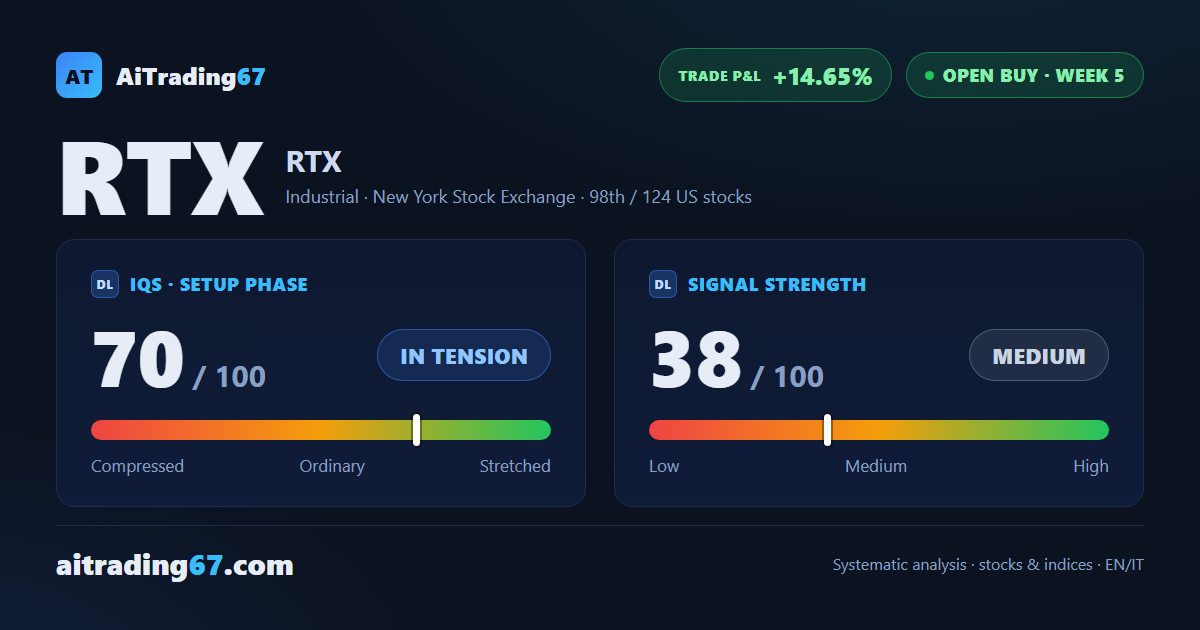
RTX shares close the week with a 10% surge, driven by the double bottom in the 179 area and now within 1% - 0.99% - of their all-time highs. Daily RSI climbs to 74, into overbought territory, and earnings land this very week: discipline calls for caution. The buy signal is in its fifth week, with the stop already moved to breakeven.
IQS Phase
70
in tension
Signal Strength
38
medium · weak
Sizing
REDUCED
Ranking
#98 / 124
US stocks in progress
Trade P&L %
+14.65%
from signal to today
Rank position
ranks 98th among the 124 Longs already running for US stocks in our ranking, with a signal strength of 38 out of 100.
Sector context
SectorIndustrial
Benchmark ETFXLI
Sector regimein positive regime
Performanceweekly +1.81% · monthly +1.36%
RTX belongs to the industrial sector (reference ETF XLI). The sector is classified in positive regime according to our weekly reading.
restricted Platinum content