
RWE: the bounce lasts just one week
RWE drops 3% as sellers reclaim control after last week's bounce
RWE: the bounce lasts just one week
Our view last week
RWE is in week 8 of a sell signal, and the week just closed posted a 7.0% rebound on 93% buying volume. The bounce grows out of a double bottom in the 54 area, with an intermediate 4% jump already on the daily chart: a clear change of pace from the two prior weeks, both of which closed lower. The technical picture still calls for a careful read.
This week's summary
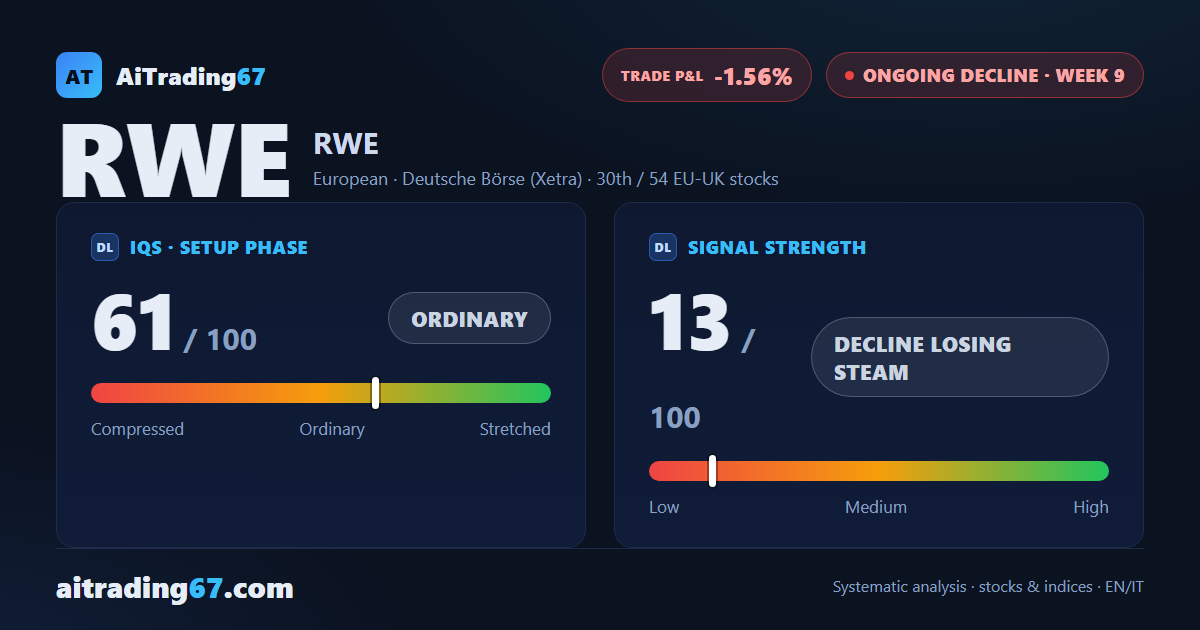
RWE's bounce lasted just one week. After the prior week's 7.0% recovery, RWE's weekly technical analysis flags a sharp reversal: this week the stock drops 3.0% on 87% sell-side volume, with sellers back in extreme control. The Sell signal is in its 9th week, and price stays boxed between the wall in the 56 area, already rejected several times, and the double-bottom support in the 54 area.
IQS Phase
61
ordinary
Signal Strength
13
decline losing steam
Sizing
MINIMUM
Ranking
#30 / 54
EU-UK stocks
Trade P&L %
-1.56%
from signal to today
restricted Platinum content