
Buy signal, week 4 · EU-UK stocks
RWE slips 0.5% as the 20-week average holds the test and the daily chart responds
Our view last week
RWE slips 1.7% after brushing its 30-week high in the 62 area: the price action turns hesitant, with volumes contracting and, after a week controlled by buyers, sellers back ahead in the weekly bar. Money flow has been positive for 4 weeks and the price holds above its 50-week average. On the technical analysis, RWE stock stays in one of our weekly buy signals, consolidating and still in profit since entry: a swing trading setup to handle calmly.
This week's summary
RWE slips 0.5% in its 2nd straight weekly decline: price dipped to the 20-week moving average, in the 57.7 area, and defended it at the close. Last week the stock was brushing its highs, this week it checked its supports, and on the daily chart the price action answers with a bullish engulfing bar. On the technical analysis RWE stock stays in one of our weekly buy signals, weekly averages aligned even as ADX and MACD lose steam: a swing trading setup that is consolidating.
IQS Phase
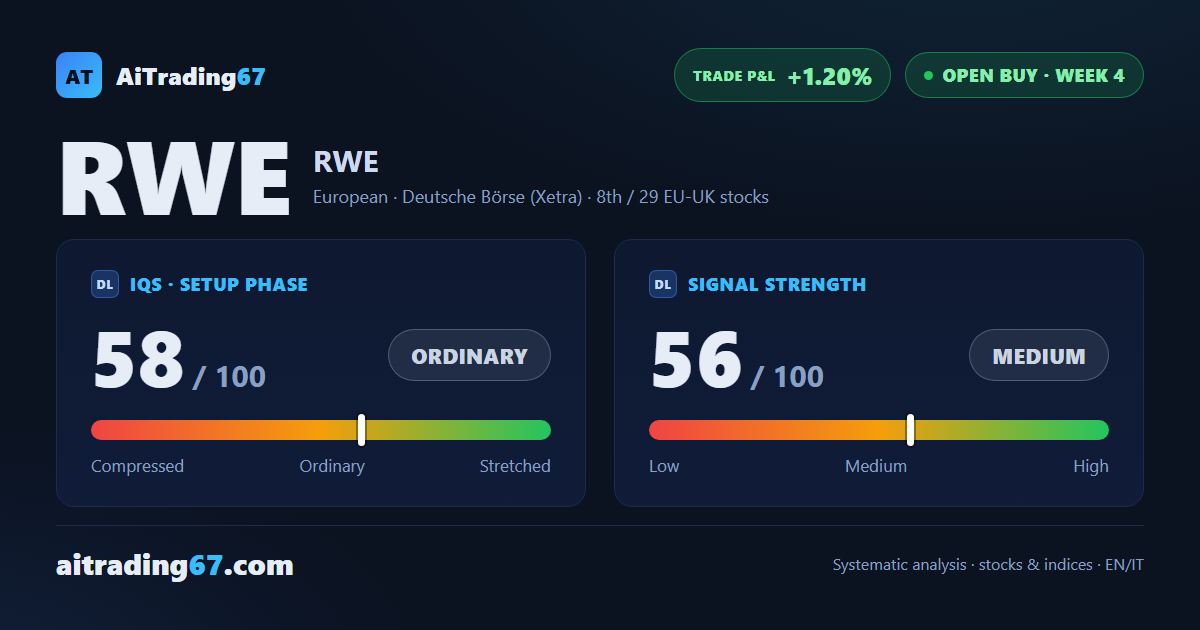
58
ordinary
Signal Strength
56
medium
Sizing
STANDARD
Ranking
#8 / 29
EU-UK stocks in progress
Trade P&L %
+1.20%
from signal to date, no stop loss
Rank position
ranks 8th among the 29 Longs already running for European-UK stocks in our ranking, with a signal strength of 56 out of 100.
Sector context
SectorEuropean
Benchmark ETFEXH9
Sector regimein positive regime
Performanceweekly +0.55% · monthly +1.10%
RWE belongs to the european sector (reference ETF EXH9). The sector is classified in positive regime according to our weekly reading.
restricted Platinum content