
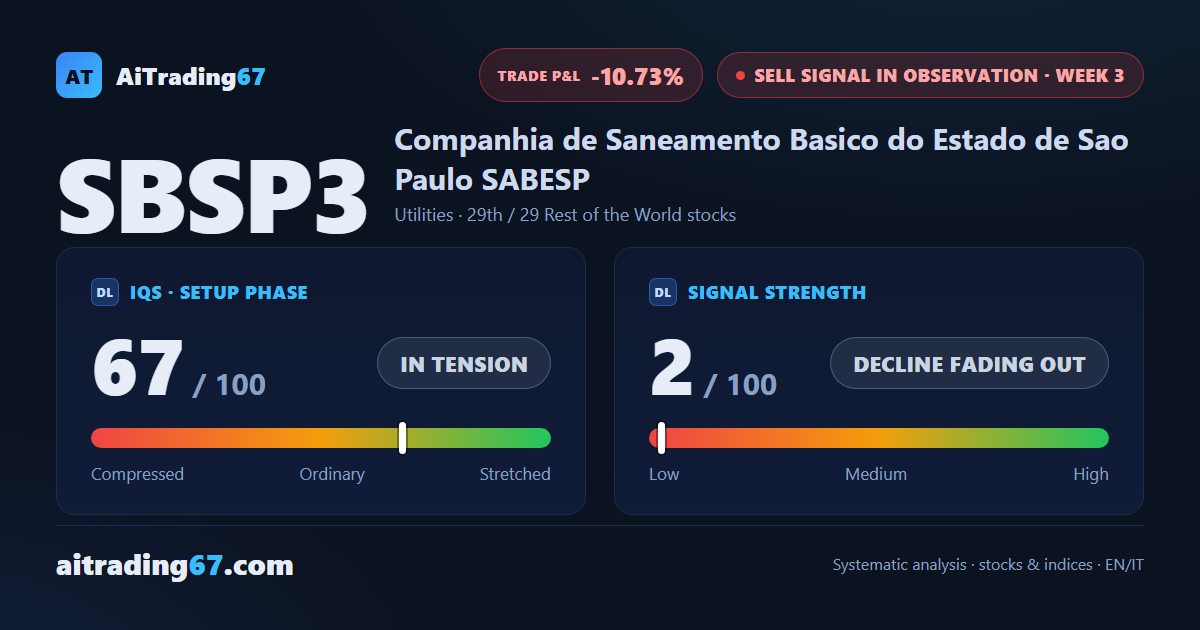
Sabesp: the sell signal loses its confirmation
Sabesp stock +8.4%: a rebound that puts the sell signal in doubt
Our view last week
Sabesp stock lost 22.8% in a week, turning last week's pause into a rout: price closed below the 50-week average, set a new 30-day low and triggered a fresh sell signal. The technical analysis stays awkward for anyone stepping in now: daily RSI at 28.9, elevated volatility and trading not recommended. In price action trading terms, lower highs were already in place, and the November 5 earnings weigh on any swing trading plan.
This week's summary
Sabesp stock rebounds 8.4% a week after the 22.8% drop that triggered the sell signal: the trade's second week closes higher and the decline goes unconfirmed. Money flow stays positive, and in price action trading terms the bounce lifts price back just under the 50-week average, in the 27.7 area. Volatility is elevated, a setup that calls for caution in any swing trading plan.
IQS Phase
46
ordinary
Signal Strength
51
weekly rebound · sell signal not confirmed
Sizing
STANDARD
Ranking
#18 / 29
Rest of the World stocks sell signals
Trade P&L %
-8.42%
from signal to date, no stop loss
Sabesp (SBSP3) weekly chart — EMA50 · MACD · VWAP
Weekly chart · EMA50 · MACD · VWAP · Source: TradingView
Rank position
ranks 18th among the 29 sell signals for titoli resto del mondo in our ranking, with a signal strength of 51 out of 100.
Sector context
SectorUtilities
Benchmark ETFXLU
Sector regimein strong phase
Performanceweekly -0.69% · monthly +4.81%
SBSP3 belongs to the utilities sector (reference ETF XLU). The sector is classified in strong phase according to our weekly reading.
restricted Platinum content