
Double bottom holds the Safran trade together
Safran slips 5.8%, but a double bottom in the 290 area holds the line
Double bottom holds the Safran trade together
Our view last week
Safran is in week 5 of a buy signal, up 16.68% since entry. The setup quality indicator sits at 75 out of 100, in maturity tension, while signal strength has settled at 56 out of 100. The stock ranks 29th among the 62 buys already running on European stocks. 1 week to the first active management window.
This week's summary
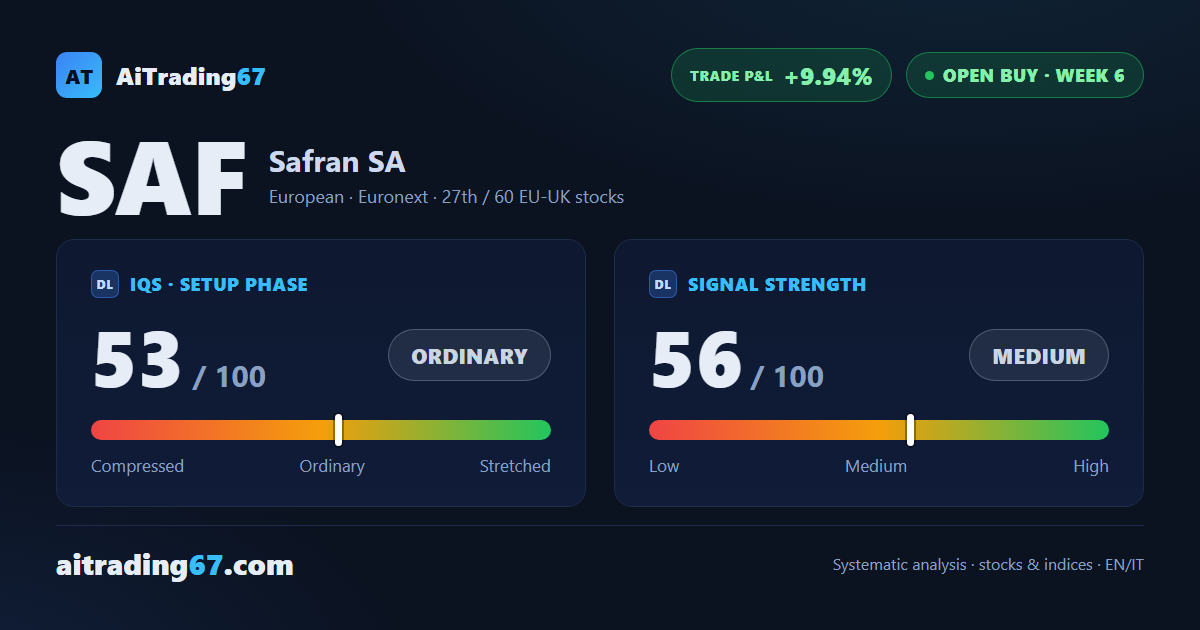
Safran shares gave back 5.8% this week, but the drop already found a floor: on the daily chart the stock carved a clean double bottom in the 290 area, with an intermediate 6% rebound. Buyers, though, are showing the first cracks, and the weekly MACD is deteriorating. This price action trading setup is now in its 6th week, up 9.94% since entry, with the stock hugging its all-time highs — one to watch closely.
IQS Phase
53
ordinary
Signal Strength
56
medium
Sizing
STANDARD
Ranking
#27 / 60
EU-UK stocks in progress
Trade P&L %
+9.94%
from signal to today
restricted Platinum content