
The buy signal holds, with less drive
Safran gives back 2% and finds support on its 50-day average
The buy signal holds, with less drive
Our view last week
Safran shares gave back 5.8% this week, but the drop already found a floor: on the daily chart the stock carved a clean double bottom in the 290 area, with an intermediate 6% rebound. Buyers, though, are showing the first cracks, and the weekly MACD is deteriorating. This price action trading setup is now in its 6th week, up 9.94% since entry, with the stock hugging its all-time highs — one to watch closely.
This week's summary
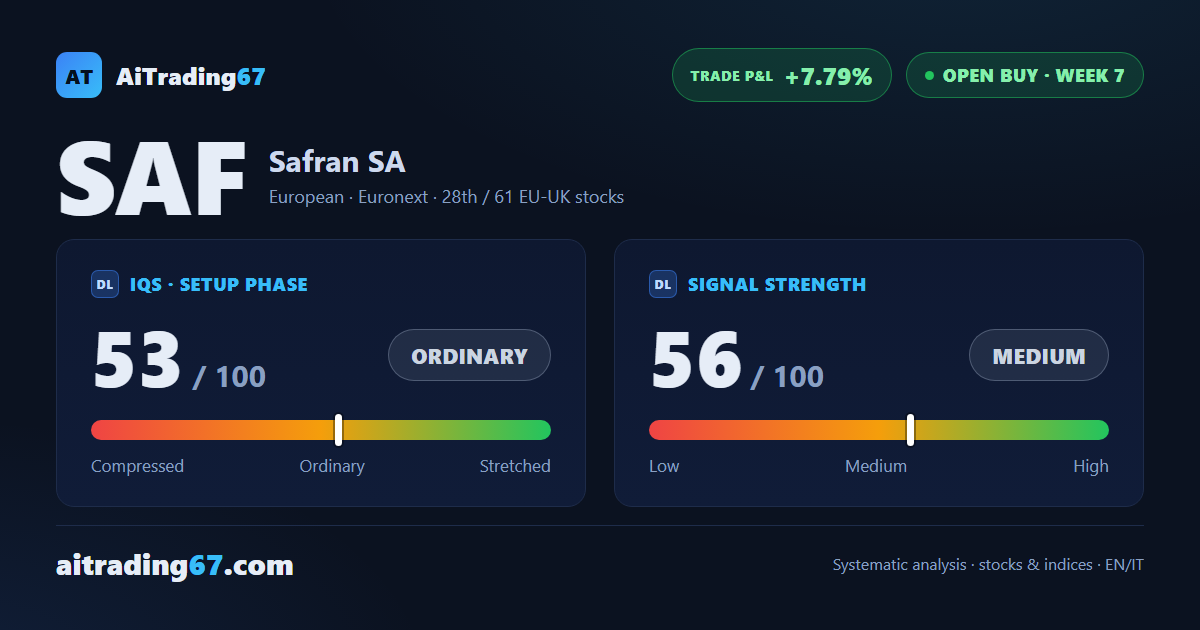
Safran shares gave back 2% this week, but the stock already found a floor: on the daily chart it bounced off its 50-day moving average, in the 321 area, recovering 2%. Under the surface buyers look less convinced — volumes contracting, mixed rejection bars — but this buy signal is now in its 7th week, up 7.79% since entry, hugging its all-time highs: a technical analysis setup worth watching, with earnings due in two weeks.
IQS Phase
53
ordinary
Signal Strength
56
medium
Sizing
STANDARD
Ranking
#28 / 61
EU-UK stocks in progress
Trade P&L %
+7.79%
from signal to today
restricted Platinum content