
Safran, buy signal in its 9th week
Safran gains 2.6% and keeps pressing the highs as the MACD cools off
Safran, buy signal in its 9th week
Our view last week
Safran shares close the week almost flat, at +0.1%, but under the surface the picture is busier: on the daily chart a double bottom has formed in the 316 area, with an intermediate rebound of 14%, while two price-action warnings - volumes rising as price falls, candle bodies losing conviction - call for some caution. Earnings are due this week, on July 28: volatility can pick up. The Buy signal, now in its 8th week of weekly technical analysis, stays up 7.88% since entry.
This week's summary
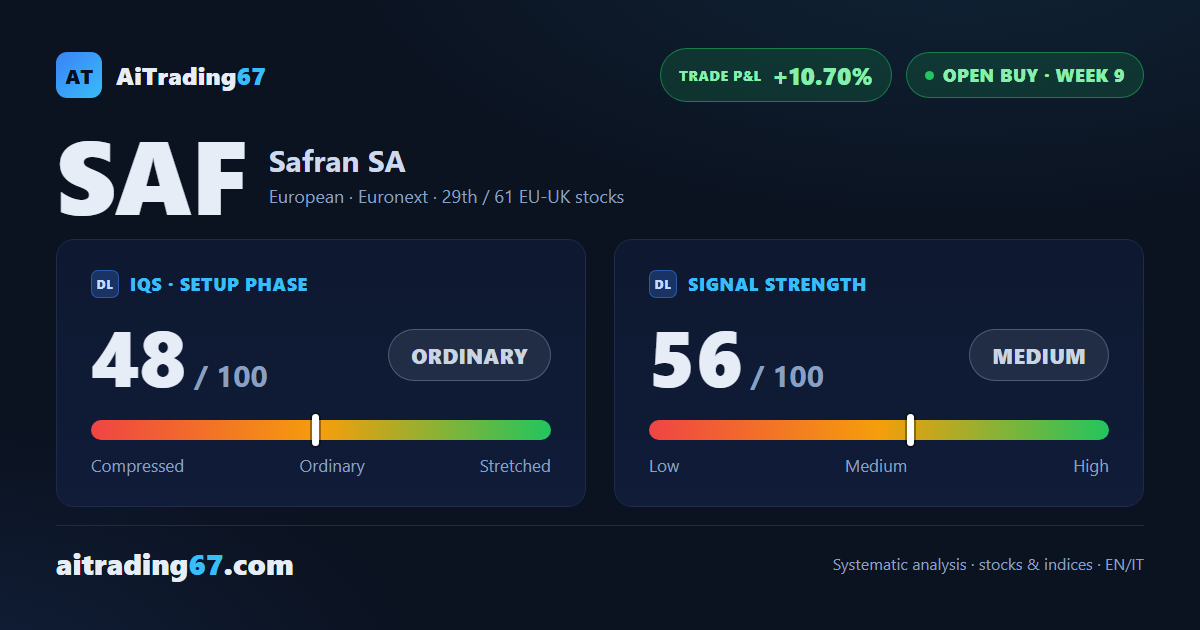
Safran shares close the week up 2.6%, but price action flags an indecisive phase: the price keeps testing the historical-high area, already rejected several times, while the weekly MACD deteriorates and the histogram fades. The buy signal, now in its 9th week, stays up 10.70% and the active stop has already tightened above entry.
IQS Phase
48
ordinary
Signal Strength
56
medium
Sizing
STANDARD
Ranking
#29 / 61
EU-UK stocks in progress
Trade P&L %
+10.70%
from signal to date, no stop loss
Rank position
ranks 29th among the 61 Longs already running for European-UK stocks in our ranking, with a signal strength of 56 out of 100.
Sector context
SectorEuropean
Benchmark ETFEXH4
Sector regimein strong phase
Performanceweekly +2.11% · monthly +0.81%
SAF belongs to the european sector (reference ETF EXH4). The sector is classified in strong phase according to our weekly reading.
restricted Platinum content