
Sell signal, week 5: the decline loses pace
Safilo gains 1.5% on 4 higher lows as weekly money flow turns positive
Our view last week
After 6 weeks of losses, Safilo stock bounces 2.8% and prints a bullish engulfing on the daily chart. Buyers take the upper hand again, though on shrinking volume, and money flow stays below zero. Our technical analysis reads a sell signal with no fresh push: strength drops from 10 to 2 out of 100, and the three observation weeks closed sideways. One of the Italian stocks to watch with caution, swing trading included.
This week's summary
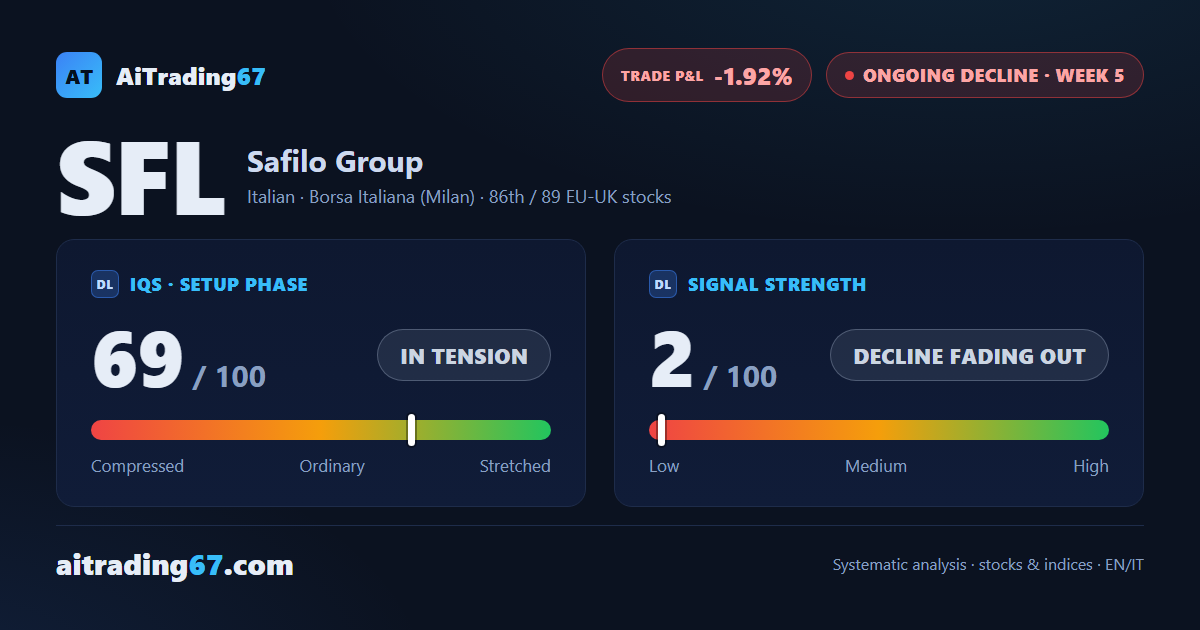
Safilo puts in a 2nd straight weekly gain, +1.5%, with 4 higher lows on the daily chart and weekly money flow back above zero, where it had not yet got to a week ago. The Sell signal is still live, and Safilo stock is climbing back toward the Inversion Point on volume that keeps shrinking. Our technical analysis reads a decline that is fading out: one of the Italian stocks to watch with caution, swing trading included.
IQS Phase
69
in tension
Signal Strength
2
decline fading out
Sizing
MINIMUM
Ranking
#86 / 89
EU-UK stocks
Trade P&L %
-1.92%
from signal to date, no stop loss
Safilo (SFL) weekly chart — EMA50 · MACD · VWAP
Weekly chart · EMA50 · MACD · VWAP · Source: TradingView
Rank position
ranks 86th among the 89 sell signals for European-UK stocks in our ranking, with a signal strength of 2 out of 100.
Sector context
SectorItalian
Benchmark ETFEXV4
Sector regimeweak phase
Performanceweekly -2.52% · monthly -5.64%
SFL belongs to the italian sector (reference ETF EXV4). The sector is classified weak phase according to our weekly reading.
restricted Platinum content