
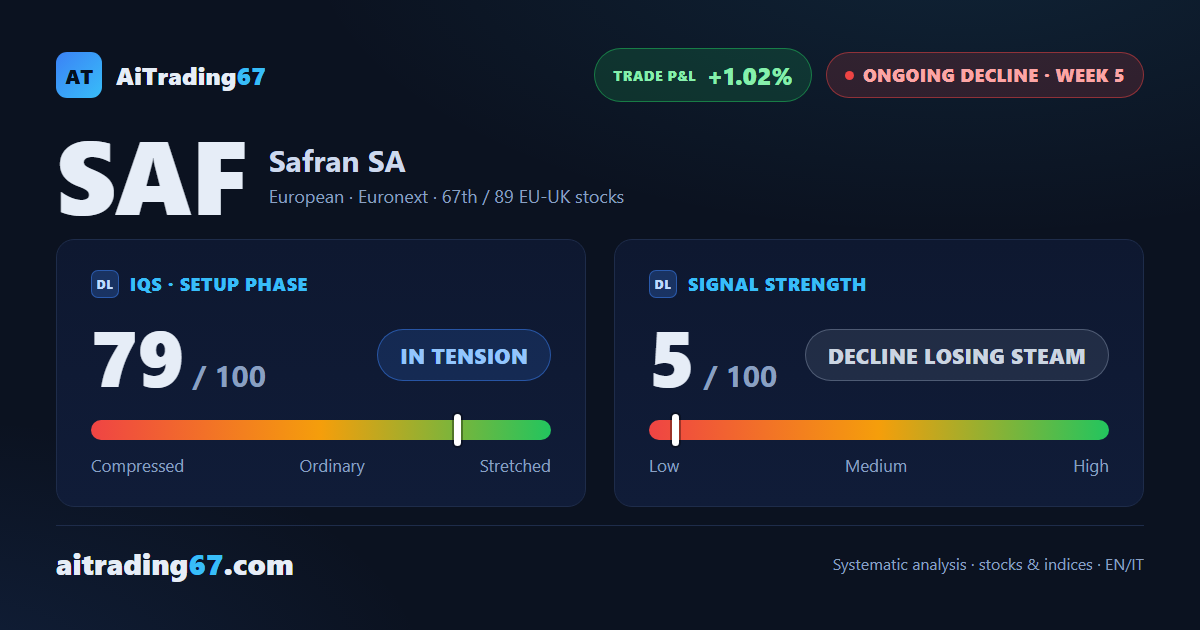
Safran · sell signal, week 5
Safran slips 1.8% as weekly money flow turns negative after 18 weeks
Our view last week
After 3 down weeks Safran climbs 4.1%: the weekly price action turns constructive, and on the daily chart the price bounces 2% off its 20-day average. A week ago the decline was heading for lower lows; now the sell signal looks hollowed out, with the 3 observation weeks closed sideways and strength down to 6 out of 100. For Safran stock the picture calls for patience, with the price boxed in between the 334 area and the 337 area.
This week's summary
Safran's weekly money flow has turned negative after 18 weeks above zero, while the stock hands back 1.8% and the run of 5 higher lows on the daily chart, in place since Sep 10, is broken. A week ago a 4.1% bounce had hollowed out the sell signal; now the price action weighs again, though Safran stock still holds above its 20-week average, in the 329 area. On the technical analysis it remains a stall, to follow level by level.
IQS Phase
79
in tension
Signal Strength
5
decline losing steam
Sizing
MINIMUM
Ranking
#67 / 89
EU-UK stocks
Trade P&L %
+1.02%
from signal to date, no stop loss
Safran (SAF) weekly chart — EMA50 · MACD · VWAP
Weekly chart · EMA50 · MACD · VWAP · Source: TradingView
Rank position
ranks 67th among the 89 sell signals for European-UK stocks in our ranking, with a signal strength of 5 out of 100.
Sector context
SectorEuropean
Benchmark ETFEXH4
Sector regimeweak phase
Performanceweekly -0.03% · monthly +0.15%
SAF belongs to the european sector (reference ETF EXH4). The sector is classified weak phase according to our weekly reading.
restricted Platinum content