Sanofi · 5th week of decline
Sanofi: decline continues but loses momentum, double bottom on the daily chart
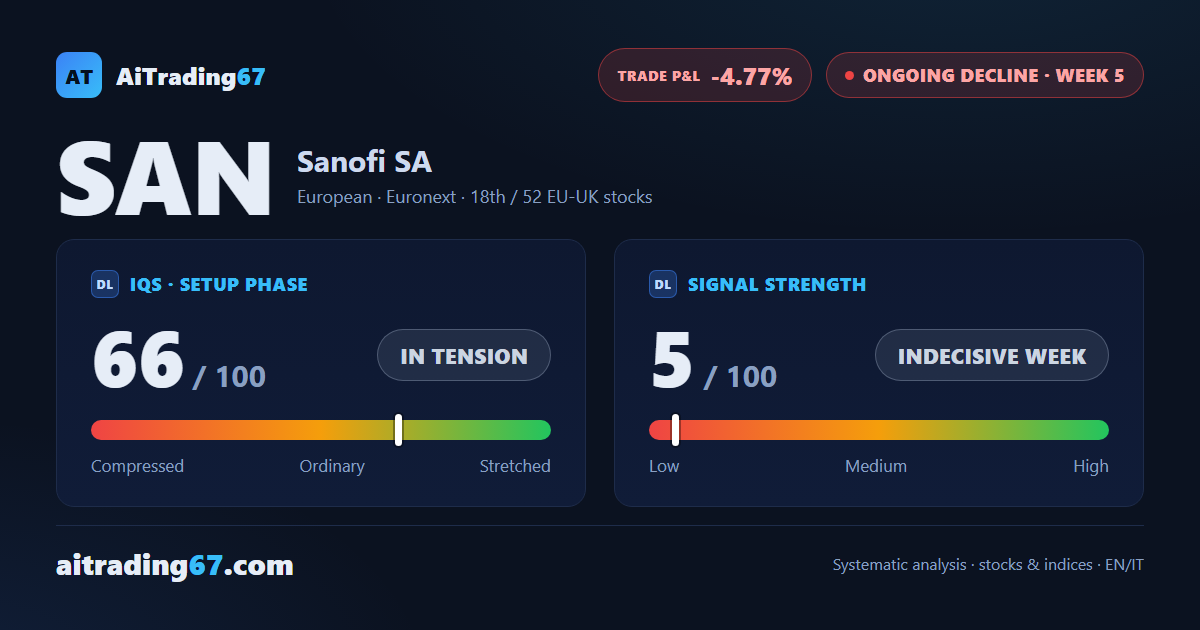
Sanofi · 5th week of decline
In Summary
Sanofi is in the 5th week of a sell signal, down -4.77%. This week closed with indecision — a small drop, balanced volumes — but the daily chart shows a double bottom in the 72 area with a 9% intermediate rebound: a signal that the market has not yet committed to a direction. Our model flags elevated-risk conditions.
IQS Phase
66
in tension
Signal Strength
5
indecisive week
Sizing
MINIMUM
Ranking
#18 / 52
EU-UK stocks
Trade P&L %
-4.77%
from signal to today
restricted Platinum content