Sanofi · Ongoing decline · Week 6
Sanofi week 6: technical rebound, but the decline is not exhausted yet
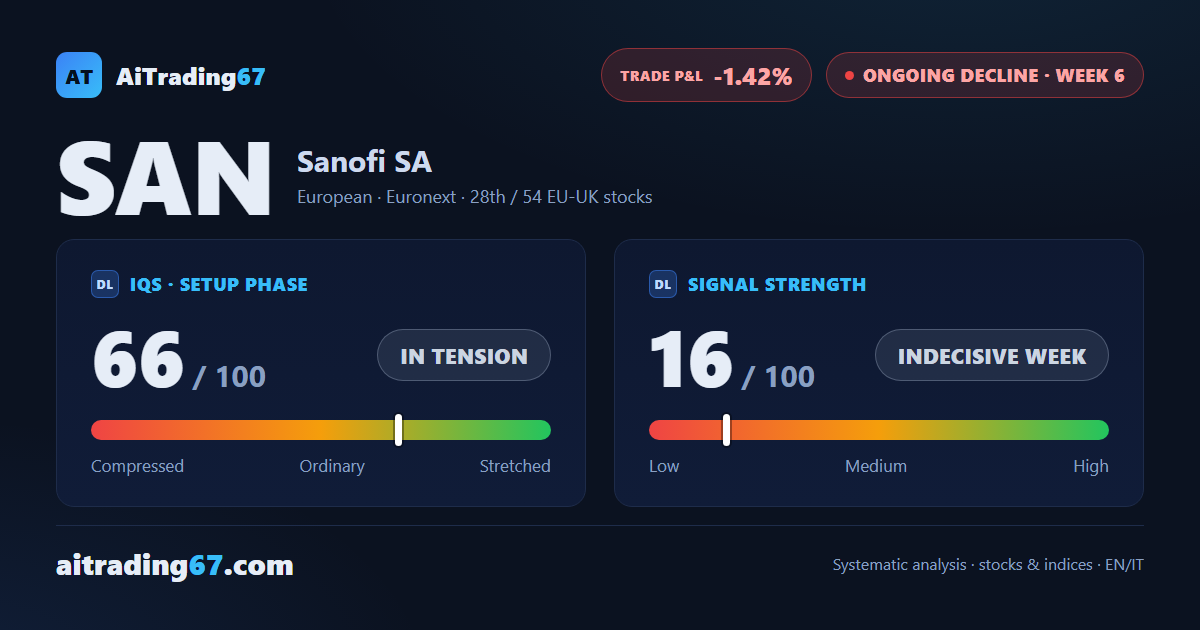
Sanofi · Ongoing decline · Week 6
In Summary
Sanofi is at week 6 of a sell signal, with a −1.42% return since the trade opened. This week closed down 3.2%, but the picture is more nuanced: a double bottom pattern has formed in the 72 area on the daily chart, with a 9% intermediate rebound — a strong pattern that introduces a layer of ambiguity. Trading not recommended per our model.
IQS Phase
66
in tension
Signal Strength
16
indecisive week
Sizing
MINIMUM
Ranking
#28 / 54
EU-UK stocks
Trade P&L %
-1.42%
from signal to today
restricted Platinum content