
The sell signal slows as the MACD turns bullish
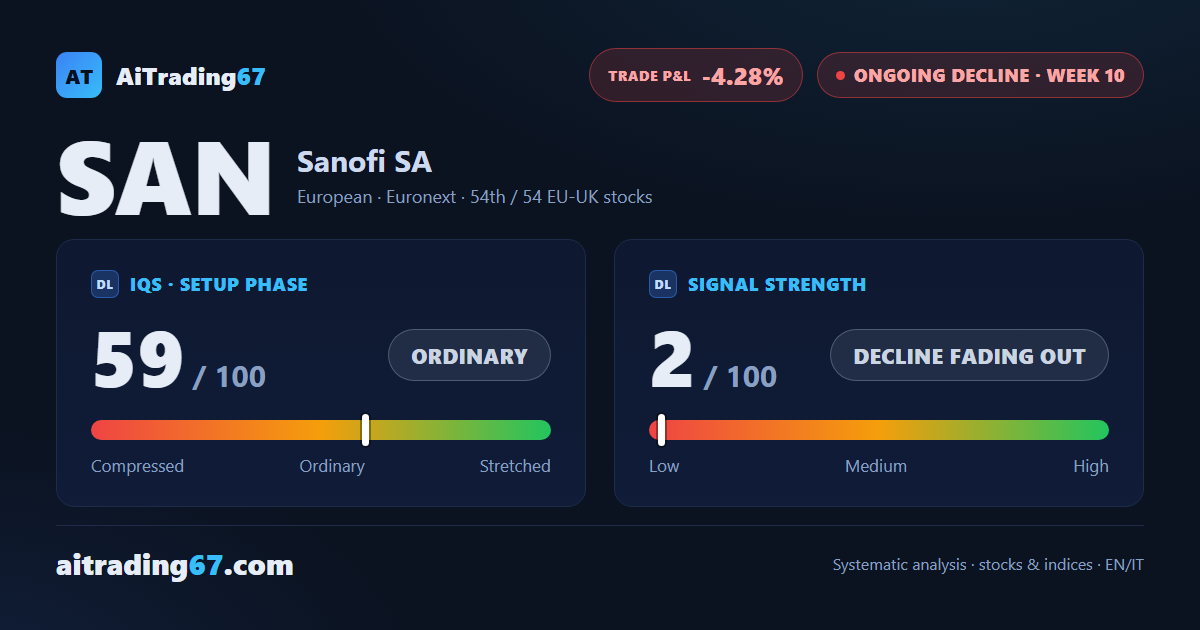
Sanofi gains 0.6% as the weekly MACD turns bullish: the decline is losing steam
The sell signal slows as the MACD turns bullish
Our view last week
Sanofi is in week 9 of a sell signal, and the recent technical picture has cooled off: a double bottom in the 72 area, a 10% rebound and fading sell volume. Earnings approach on July 30.
This week's summary
Sanofi's weekly MACD has just crossed bullish — confirming a cooling in the sell signal that was already underway last week — while money flow has stayed firmly positive for three straight weeks: this week's technical analysis shows the decline increasingly under pressure. The week closed with a modest 0.6% gain on an indecisive candle that grazed resistance above the 77 area without breaking it. The short, open for ten weeks, is now down 4.3%.
IQS Phase
59
ordinary
Signal Strength
2
decline fading out
Sizing
MINIMUM
Ranking
#54 / 54
EU-UK stocks
Trade P&L %
-4.28%
from signal to today
restricted Platinum content