
Sanofi: the sell signal hangs in the balance
Sanofi slips 1.7% and edges back toward the Inversion Point
Sanofi: the sell signal hangs in the balance
Our view last week
Sanofi keeps confirming the cooling of its sell signal: after last week's bullish MACD cross, the stock closes another week up 1.5%, with money flow pushing even further into positive territory and the weekly RSI climbing to 48. The price stays boxed into a very tight corridor between two moving averages, just as earnings approach on July 30: the short, open for ten weeks, now slips to a 5.8% loss.
This week's summary
Sanofi shares stay boxed in a very tight corridor, right at the edge of the Inversion Point in the 77.8 area: this week the stock slipped 1.7% and sellers took back control of volume, reversing the pattern of the previous three weeks. Momentum, negative for a month, turned positive for the first time, while the MACD closes in on a bullish cross. The short, open for 11 weeks, stays just over 4% underwater, with earnings due July 30 keeping attention high.
IQS Phase
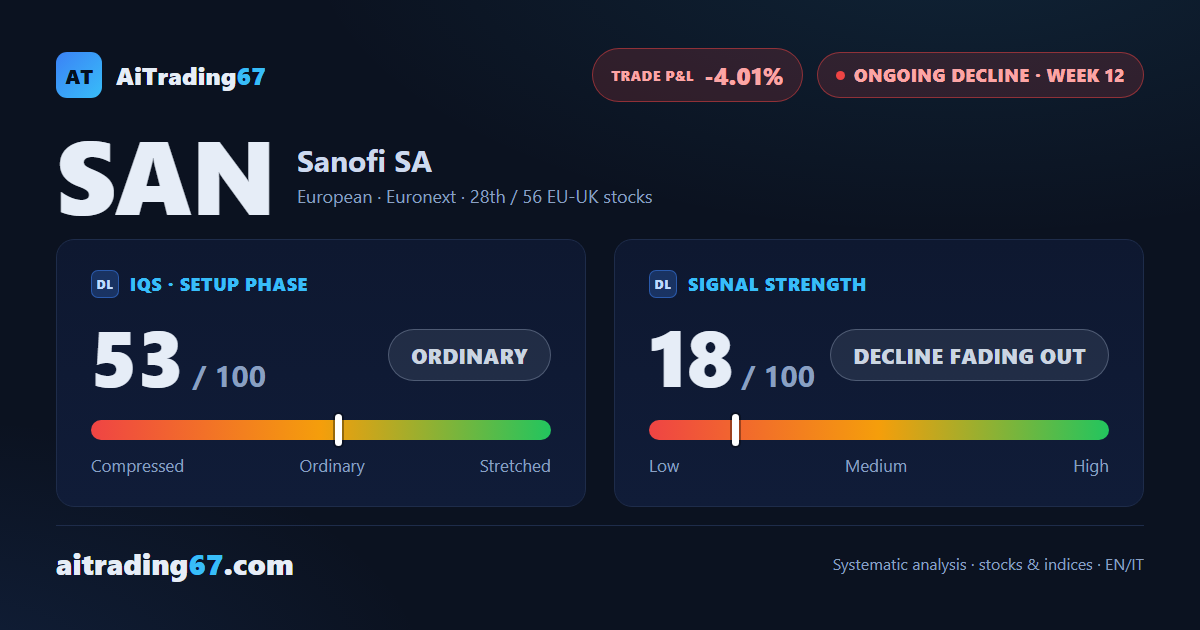
53
ordinary
Signal Strength
18
decline fading out
Sizing
MINIMUM
Ranking
#28 / 56
EU-UK stocks
Trade P&L %
-4.01%
from signal to today
Rank position
ranks 28th among the 56 sell signals for European-UK stocks in our ranking, with a signal strength of 18 out of 100.
Sector context
SectorEuropean
Benchmark ETFEXV4
Sector regimein positive regime
Performanceweekly +0.19% · monthly -0.21%
SAN belongs to the european sector (reference ETF EXV4). The sector is classified in positive regime according to our weekly reading.
restricted Platinum content