
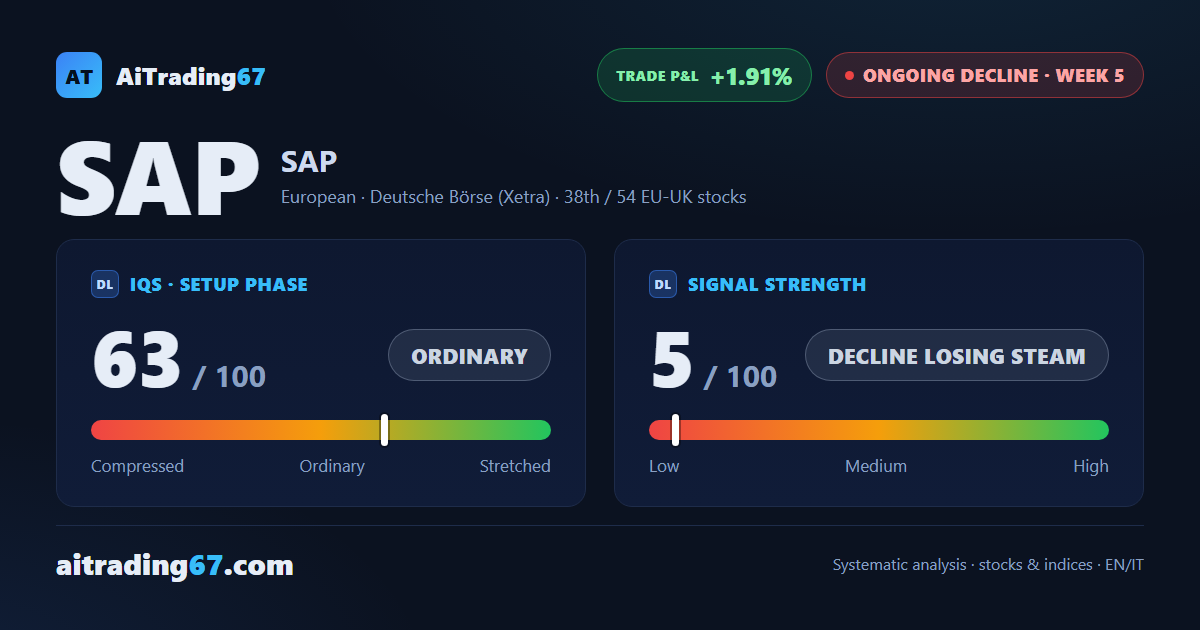
SAP: decline stalls as sellers retake control
SAP slips 1.5%, but the daily chart is building a base of higher lows
SAP: decline stalls as sellers retake control
Our view last week
SAP is in its fourth week of a sell signal, and the week just closed recovered 3.3%: the decline is finding no new momentum, and signal strength drops to 2 out of 100. The setup quality indicator, at 58 out of 100, stays in the ordinary range, and the stock ranks 33rd among the 54 European sell signals. The three observation weeks so far have not yet confirmed the signal.
This week's summary
SAP shares slipped 1.5% this week: sellers retook control after two weeks led by buyers, though the decline is not tightening its grip any further. The technical picture looks balanced — on the daily chart the stock built four higher lows, from the 131 area to the 134 area, while price stays boxed into a tight corridor toward the 138 area. The Sell signal is alive, but its push is fading.
IQS Phase
63
ordinary
Signal Strength
5
decline losing steam
Sizing
MINIMUM
Ranking
#38 / 54
EU-UK stocks
Trade P&L %
+1.91%
from signal to today
restricted Platinum content