
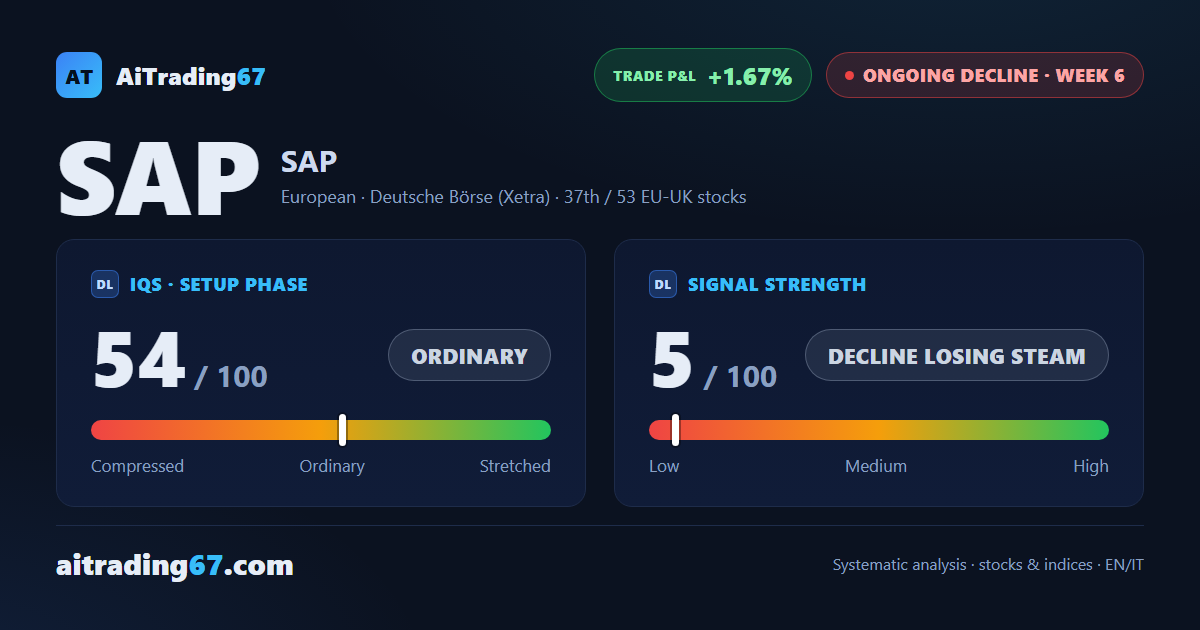
SAP: the decline slows, sixth week of management
SAP flat at +0.2%: the decline loses steam inside the 137-139 corridor
SAP: the decline slows, sixth week of management
Our view last week
SAP shares slipped 1.5% this week: sellers retook control after two weeks led by buyers, though the decline is not tightening its grip any further. The technical picture looks balanced — on the daily chart the stock built four higher lows, from the 131 area to the 134 area, while price stays boxed into a tight corridor toward the 138 area. The Sell signal is alive, but its push is fading.
This week's summary
A nearly flat week for SAP: the stock closed at +0.2%, with buyers taking 66% of the volume but failing to push price past the 139 area - an indecisive candle, its body thin. Underneath, the decline is losing steam: the weekly MACD keeps improving and money flow, still negative, has grown lighter over recent weeks. The sell signal stays active, but its push is fading.
IQS Phase
54
ordinary
Signal Strength
5
decline losing steam
Sizing
MINIMUM
Ranking
#37 / 53
EU-UK stocks
Trade P&L %
+1.67%
from signal to today
restricted Platinum content