
Open buy · week 9 · EU-UK stocks
SAP slips 1.1% as the 100-week average turns price back and the trend loses pace
Our view last week
After 3 weeks with sellers ahead, buyers take back SAP's weekly bar and money flow, positive for 10 weeks, starts rising again. SAP stock closes up 1.5% after a 2% bounce off the 20-day moving average, boxed in between the 7-day high, in the 189.2 area, and the daily Inversion Point average, in the 185.2 area. For swing trading and price action, the buy signal still ranks first among 41 open European longs, +17.9% since entry.
This week's summary
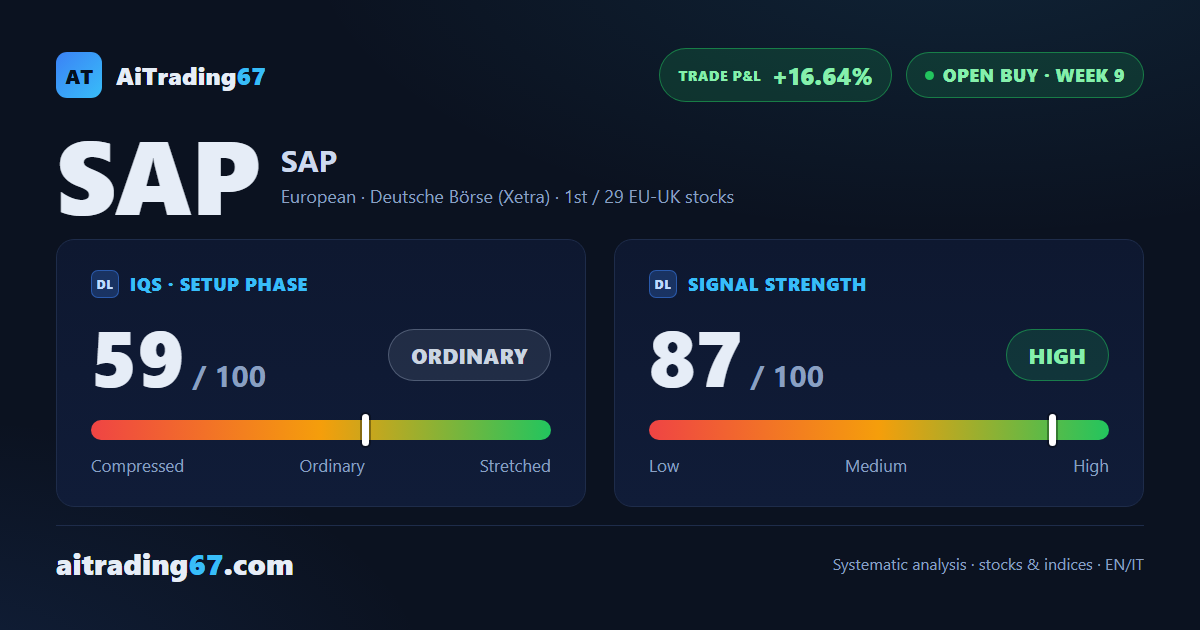
After 2 weeks of gains the recovery ran out at the 100-week moving average, in the 186 area: SAP was turned back and closed down 1.1%, with a bearish engulfing on the daily chart and contracting volumes. SAP stock still holds above its 50-week average, and money flow has been positive for 11 weeks. For swing trading and price action trading, the buy signal still ranks 1st among the 29 open European longs, +16.6% since entry, with earnings on October 21 drawing near.
IQS Phase
59
ordinary
Signal Strength
87
high · wide move
Sizing
FULL
Ranking
#1 / 29
EU-UK stocks in progress
Trade P&L %
+16.64%
from signal to date, no stop loss
Rank position
ranks 1st among the 29 Longs already running for European-UK stocks in our ranking, with a signal strength of 87 out of 100.
Sector context
SectorEuropean
Benchmark ETFEXV3
Sector regimein positive regime
Performanceweekly +5.44% · monthly +7.36%
SAP belongs to the european sector (reference ETF EXV3). The sector is classified in positive regime according to our weekly reading.
restricted Platinum content