
Starbucks: week two, bounce confirmed
Starbucks climbs 1.7%, confirming the bounce off its 20-day average
Starbucks: week two, bounce confirmed
Our view last week
Starbucks opens a new buy signal, confirmed by the following week: the weekly structure is fully aligned to the upside and the daily technical picture shows a clean bounce off its own moving average. Signal strength is medium, 55 out of 100, and the stock ranks 62nd among the 125 buy positions already running on US stocks. Price, though, is working right against an area that has already been tested several times: an entry to handle with selectivity.
This week's summary
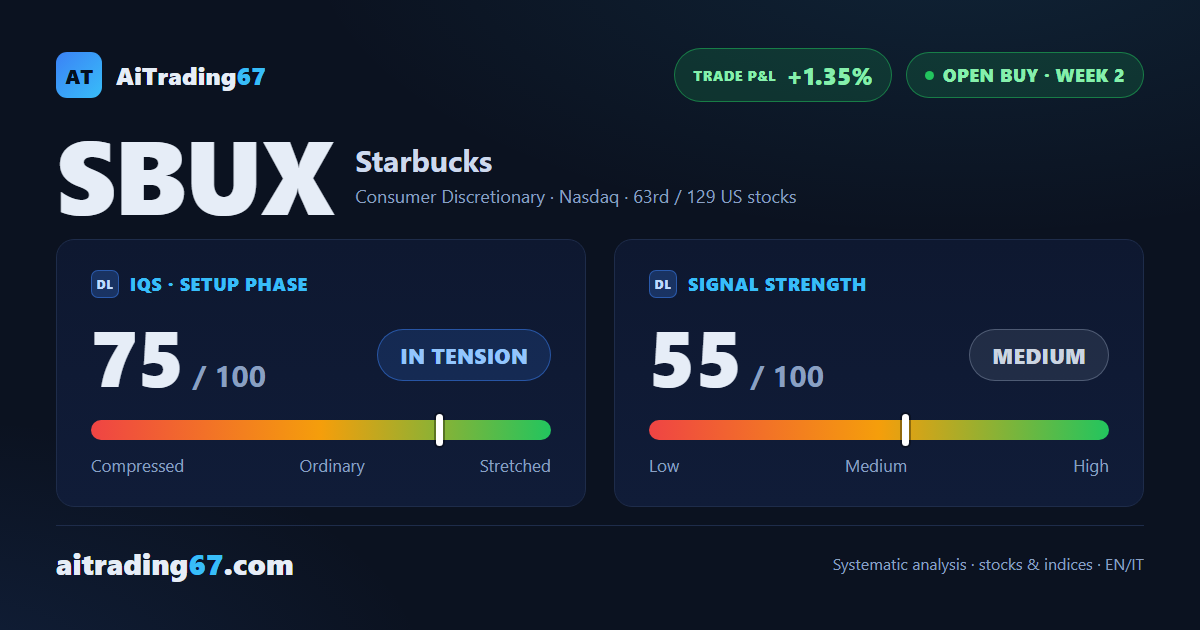
Starbucks closes the week with a clean bounce off its own 20-day moving average: a touch in the 102 area, a 4% recovery, for a weekly performance of +1.7%. The structure stays fully aligned to the upside and the setup quality indicator climbs to 75 out of 100, in tension. Starbucks stock, though, is still working right against an area that has been tested several times: this week's technical analysis calls for a selective entry, not for chasing the move.
IQS Phase
75
in tension
Signal Strength
55
medium
Sizing
STANDARD
Ranking
#63 / 129
US stocks in progress
Trade P&L %
+1.35%
from signal to today
restricted Platinum content