
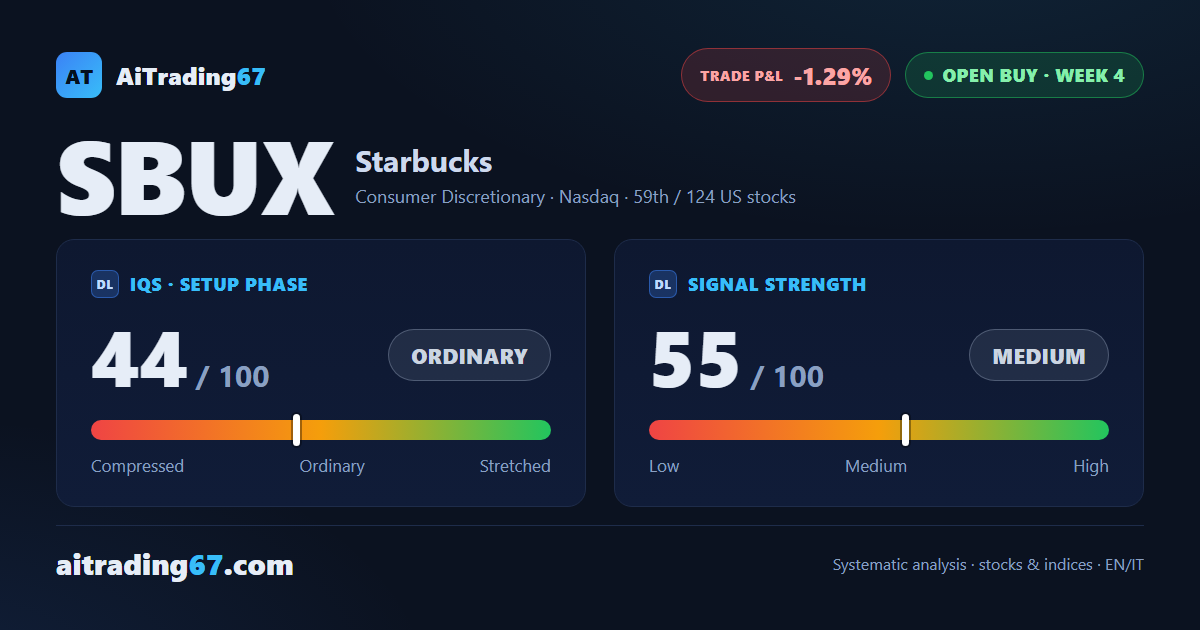
Buy signal, week 4
Starbucks slips 2.1% and breaks its breakeven stop: the model keeps watching for a reversal
Buy signal, week 4
Our view last week
Starbucks stock closes the week down 0.5%, with a bearish engulfing candle that marks sellers taking firm control right at the edge of an area already tested three times over the past ten weeks. Buy volume collapses below 10%, a sign that buying pressure has faded. The weekly structure, though, stays intact, with all structural moving averages aligned to the upside: for our model, the disciplined move here is to hold the position, not chase a fresh entry.
This week's summary
Starbucks slips 2.1% this week: on the daily chart the stock carves out a double bottom in the 99 area, with a 5% rebound, though sellers stay slightly prevalent and buy volume drops to 6%, while the structural moving averages stay aligned higher. Price closed below the breakeven stop flagged in last week's card (104.6 area): for anyone following that level the trade is closed.
IQS Phase
44
ordinary
Signal Strength
55
medium
Sizing
STANDARD
Ranking
#59 / 124
US stocks in progress
Trade P&L %
-1.29%
from signal to date, no stop loss
Rank position
ranks 59th among the 124 Longs already running for US stocks in our ranking, with a signal strength of 55 out of 100.
Sector context
SectorConsumer Discretionary
Benchmark ETFXLY
Sector regimeweak phase
Performanceweekly -5.22% · monthly -4.92%
SBUX belongs to the consumer discretionary sector (reference ETF XLY). The sector is classified weak phase according to our weekly reading.
restricted Platinum content