
SCHE: the wall above the 36 area still holds
SCHE gives back 3.2% as the wall of averages above the 36 area holds firm
SCHE: the wall above the 36 area still holds
Our view last week
This week's bounce carried the Schwab Emerging Markets Equity ETF back onto a clean double bottom in the 35 area, after a 7% intermediate rebound: the week closed up 1.9%, with buyers making up 95% of volume. After weeks of losing steam, price now runs into a solid wall just under the 37 area, rejected repeatedly over the past three weeks, while the weekly ADX slips and money flow cools off. In week 12, the trade sits on a modest gain, at 1.5%.
This week's summary
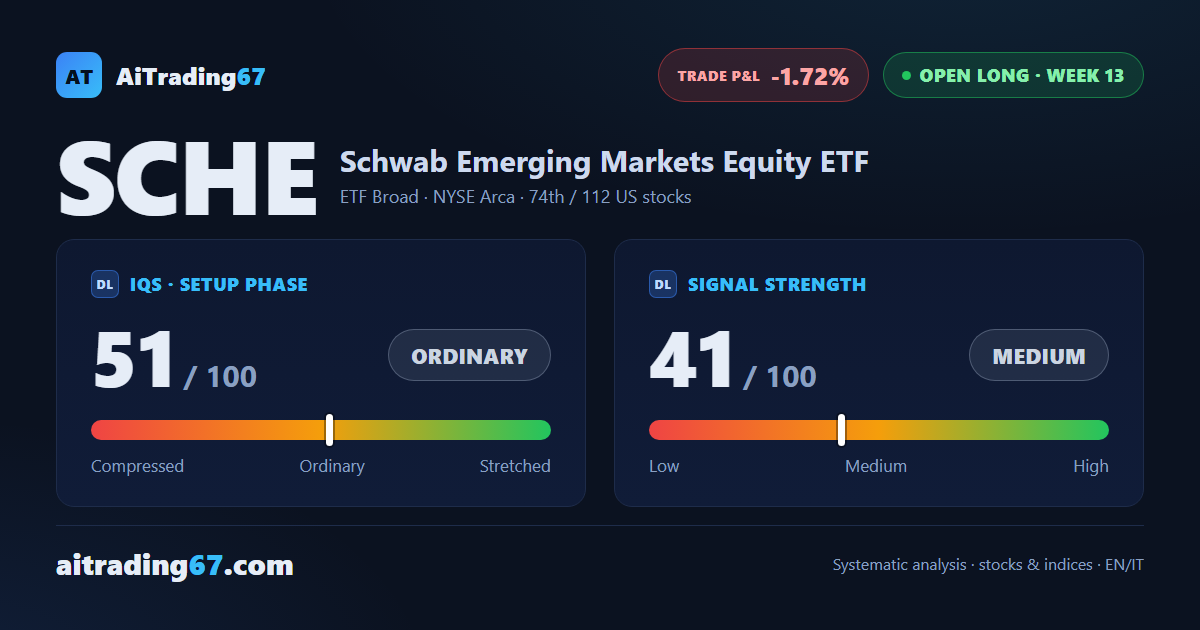
SCHE technical analysis: the Schwab Emerging Markets Equity ETF, this week's read is one of rejection: the fund gave back 3.2%, running once again into the wall of averages just above the 36 area already touched in recent days. Sellers dominated 74% of volume and money flow turned negative again after weeks in positive territory. The trade, in its 13th week, has slipped from a modest gain into a small loss, while the weekly ADX keeps sliding.
IQS Phase
51
ordinary
Signal Strength
41
medium · weak
Sizing
REDUCED
Ranking
#74 / 112
US stocks in progress
Trade P&L %
-1.72%
from signal to today
restricted Platinum content