
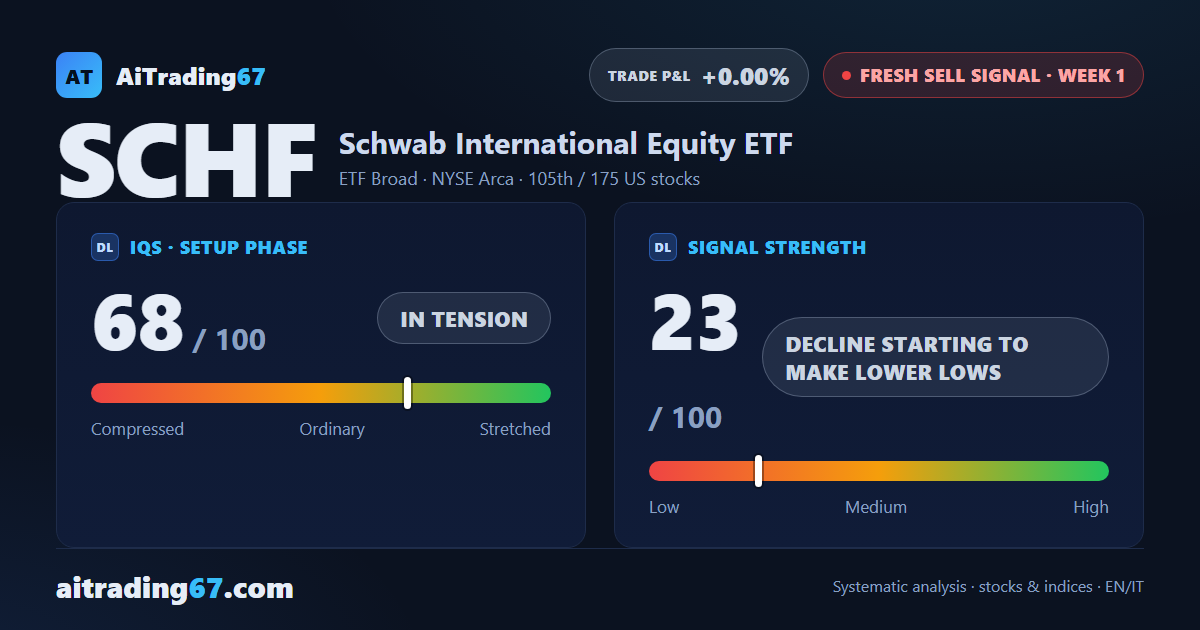
New Sell signal · week 1
SCHF slips 1.2% to a 30-day low that the weekly close fails to confirm
Our view last week
SCHF edges up 0.7% and is back at its highs in the 28 area, the 7th test in 10 weeks: no session has turned it away yet, so for now the move under way continues. After two weeks of sellers, buyers are back in control of the tape. SCHF technical analysis still calls for caution, though: the international equity ETF shows an ADX falling for 4 weeks and price action trading that is still indecisive. The buy signal stands at -2% since the open.
This week's summary
SCHF slips 1.2% and prints a fresh 30-day low in the 27.1 area, but the weekly close fails to confirm it: price still finishes above its 20-week moving average. A week ago it was testing its highs in the 28 area; now a new Sell signal has triggered on SCHF, the Schwab international equity ETF. SCHF technical analysis stays mixed, though: ADX falling for 5 weeks, structural moving averages still aligned, money flow positive. A swing trading setup to watch, with trading not recommended.
IQS Phase
68
in tension
Signal Strength
23
decline starting to make lower lows
Sizing
MINIMUM
Ranking
#105 / 175
New us stocks
Trade P&L %
+0.00%
from signal to date, no stop loss
SCHF International Equity weekly chart — EMA50 · MACD · VWAP
Weekly chart · EMA50 · MACD · VWAP · Source: TradingView
Rank position
ranks 105th among the 175 sell signals for US stocks in our ranking, with a signal strength of 23 out of 100.
Sector context
SectorETF Broad
Benchmark ETF—
Sector regime
Performanceweekly coming soon · monthly coming soon
SCHF belongs to the etf broad sector (reference ETF ).
restricted Platinum content