
5.3% rebound, signal strength near zero
SolarEdge rebounds 5.3% off a double bottom, and the sell signal loses its push
5.3% rebound, signal strength near zero
Our view last week
SolarEdge Technologies is in week 2 of a sell signal, and the week just closed recovered 1.2%. Signal strength drops to 35 out of 100: the decline has lost its fresh momentum, but it isn't running on empty yet. The setup quality indicator stays high at 80 out of 100, and the stock ranks 19th among 137 US sell signals.
This week's summary
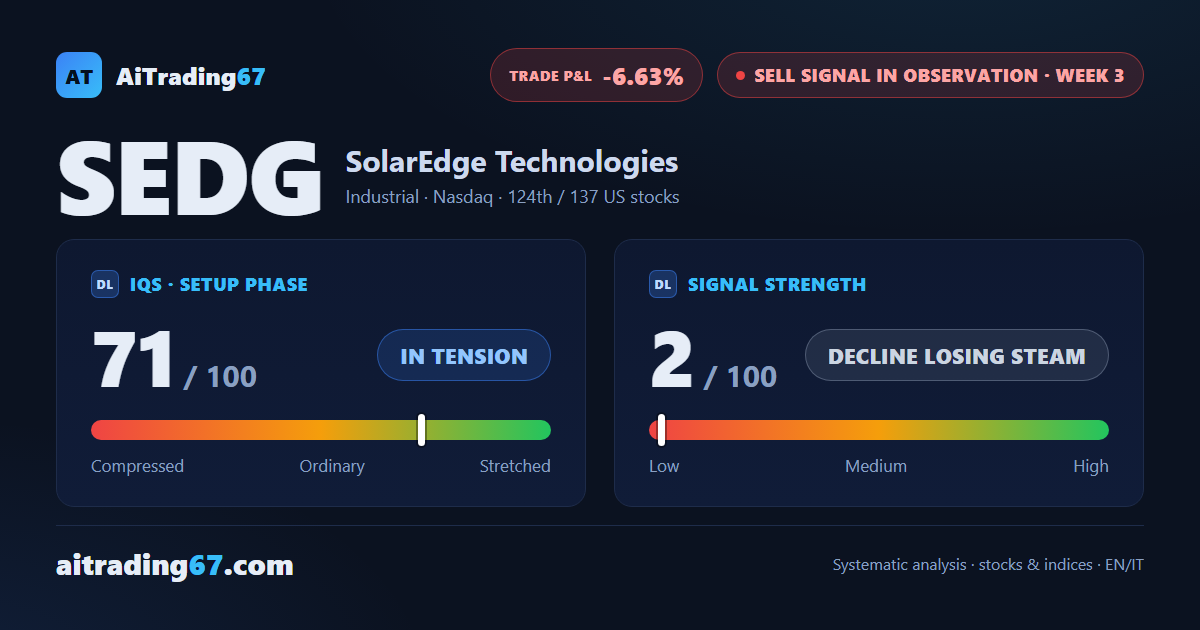
SolarEdge shares rebound 5.3% off a clean double bottom in the 48 area, a 28% recovery from the lows that saps the sell signal's push: strength drops to 2 out of 100. Daily volume still favors sellers, yet price is now working above the weekly cloud - a finely balanced picture the quality band flags as not recommended for new trades.
Sell signal in observation
·3rd week from start
·US stocks
·T2
·📅 Earnings · Aug 4
★ See Gold version →
IQS Phase
71
in tension
Signal Strength
2
decline losing steam
Sizing
MINIMUM
Ranking
#124 / 137
US stocks sell signals
Trade P&L %
-6.63%
from signal to today
restricted Platinum content