
Sell signal under watch, week 4
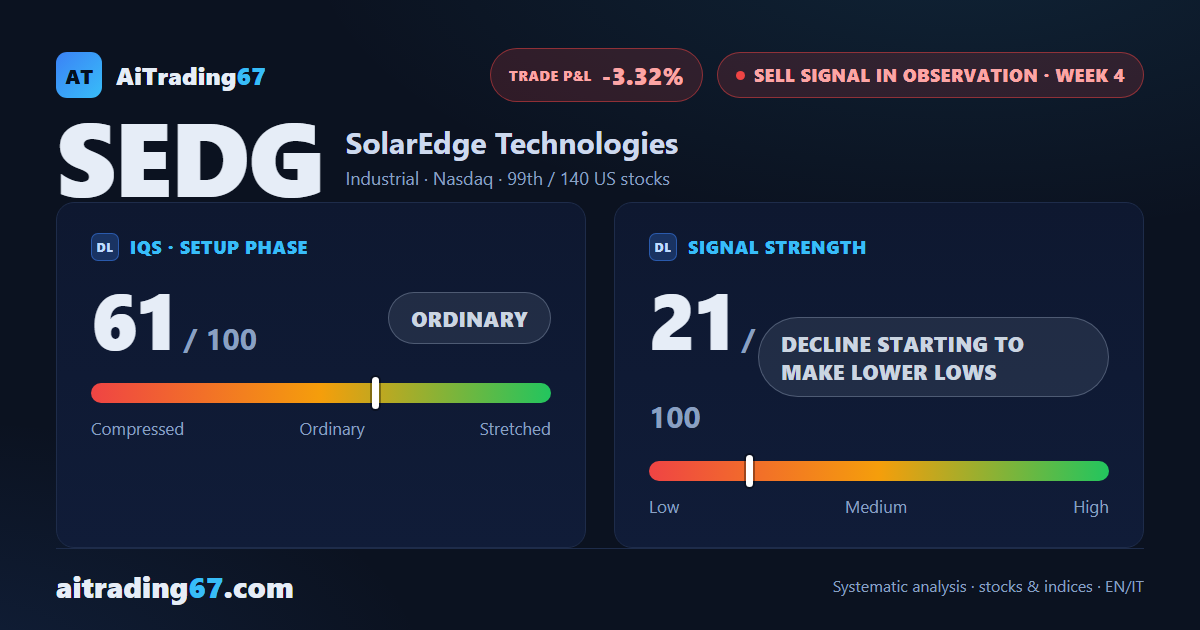
SolarEdge slips 3.1% as the sell signal makes fresh lower lows while sellers lose their edge
Sell signal under watch, week 4
Our view last week
SolarEdge shares rebound 5.3% off a clean double bottom in the 48 area, a 28% recovery from the lows that saps the sell signal's push: strength drops to 2 out of 100. Daily volume still favors sellers, yet price is now working above the weekly cloud - a finely balanced picture the quality band flags as not recommended for new trades.
This week's summary
SolarEdge shares slip 3.1% this week in our latest technical analysis, pulling back after last week's bounce off the double bottom near the 48 area. Sellers still hold the edge but with less conviction: volumes are contracting, the final candle is indecisive and rejection signals are mixed. On the weekly chart ADX is losing steam while MACD stays negative - a picture still bearish, just softer than seven days ago.
Sell signal in observation
·4th week from start
·US stocks
·T2
·📅 Earnings · Aug 4
★ See Gold version →
IQS Phase
61
ordinary
Signal Strength
21
decline starting to make lower lows
Sizing
MINIMUM
Ranking
#99 / 140
US stocks sell signals
Trade P&L %
-3.32%
from signal to today
restricted Platinum content