
SolarEdge, the decline slows in week 6
SolarEdge stock sheds 3.3%: the decline slows but distribution continues
SolarEdge, the decline slows in week 6
Our view last week
SolarEdge shares plunge 20.3% this week, breaking below the double bottom near the 48 area that had held up in our weekly technical analysis for the past few weeks. Sellers take full control - 94% of the week's volume on the sell side - and money flow flips negative after weeks of accumulation. The sell signal, live for a month, is now up more than 17%; price is sliding toward the lower edge of our No-Trade Zone.
This week's summary
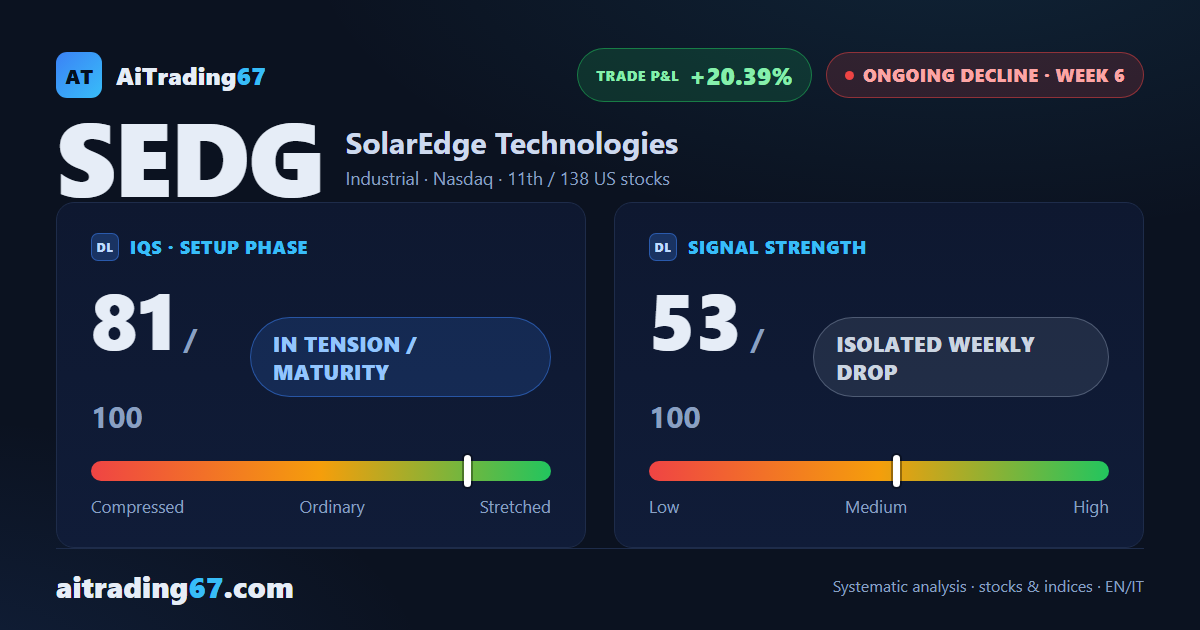
SolarEdge stock sheds another 3.3% this week after last week's 20.3% plunge. Volumes are back in balance, 50% buyers and 50% sellers, but money flow slides even further negative and momentum caves in: the distribution phase flagged by the price action is still underway. Price is climbing back toward the 50-week average, in the 43 area. The decline, in management for 6 weeks, still sits at a 20% gain; quarterly earnings land this very week.
IQS Phase
81
in tension / maturity
Signal Strength
53
isolated weekly drop
Sizing
STANDARD
Ranking
#11 / 138
US stocks
Trade P&L %
+20.39%
from signal to date, no stop loss
Rank position
ranks 11th among the 138 sell signals for US stocks in our ranking, with a signal strength of 53 out of 100.
Sector context
SectorIndustrial
Benchmark ETFXLI
Sector regimein positive regime
Performanceweekly -1.54% · monthly -1.92%
SEDG belongs to the industrial sector (reference ETF XLI). The sector is classified in positive regime according to our weekly reading.
restricted Platinum content